
TL;DR — The Numbers That Define Road Crash Consequences
- 1.19 million killed annually — road traffic crashes remain the leading cause of death for people aged 5–29 worldwide (WHO, 2023).
- 20–50 million injured each year — many sustaining permanent disability that reshapes every dimension of their lives (WHO, 2023).
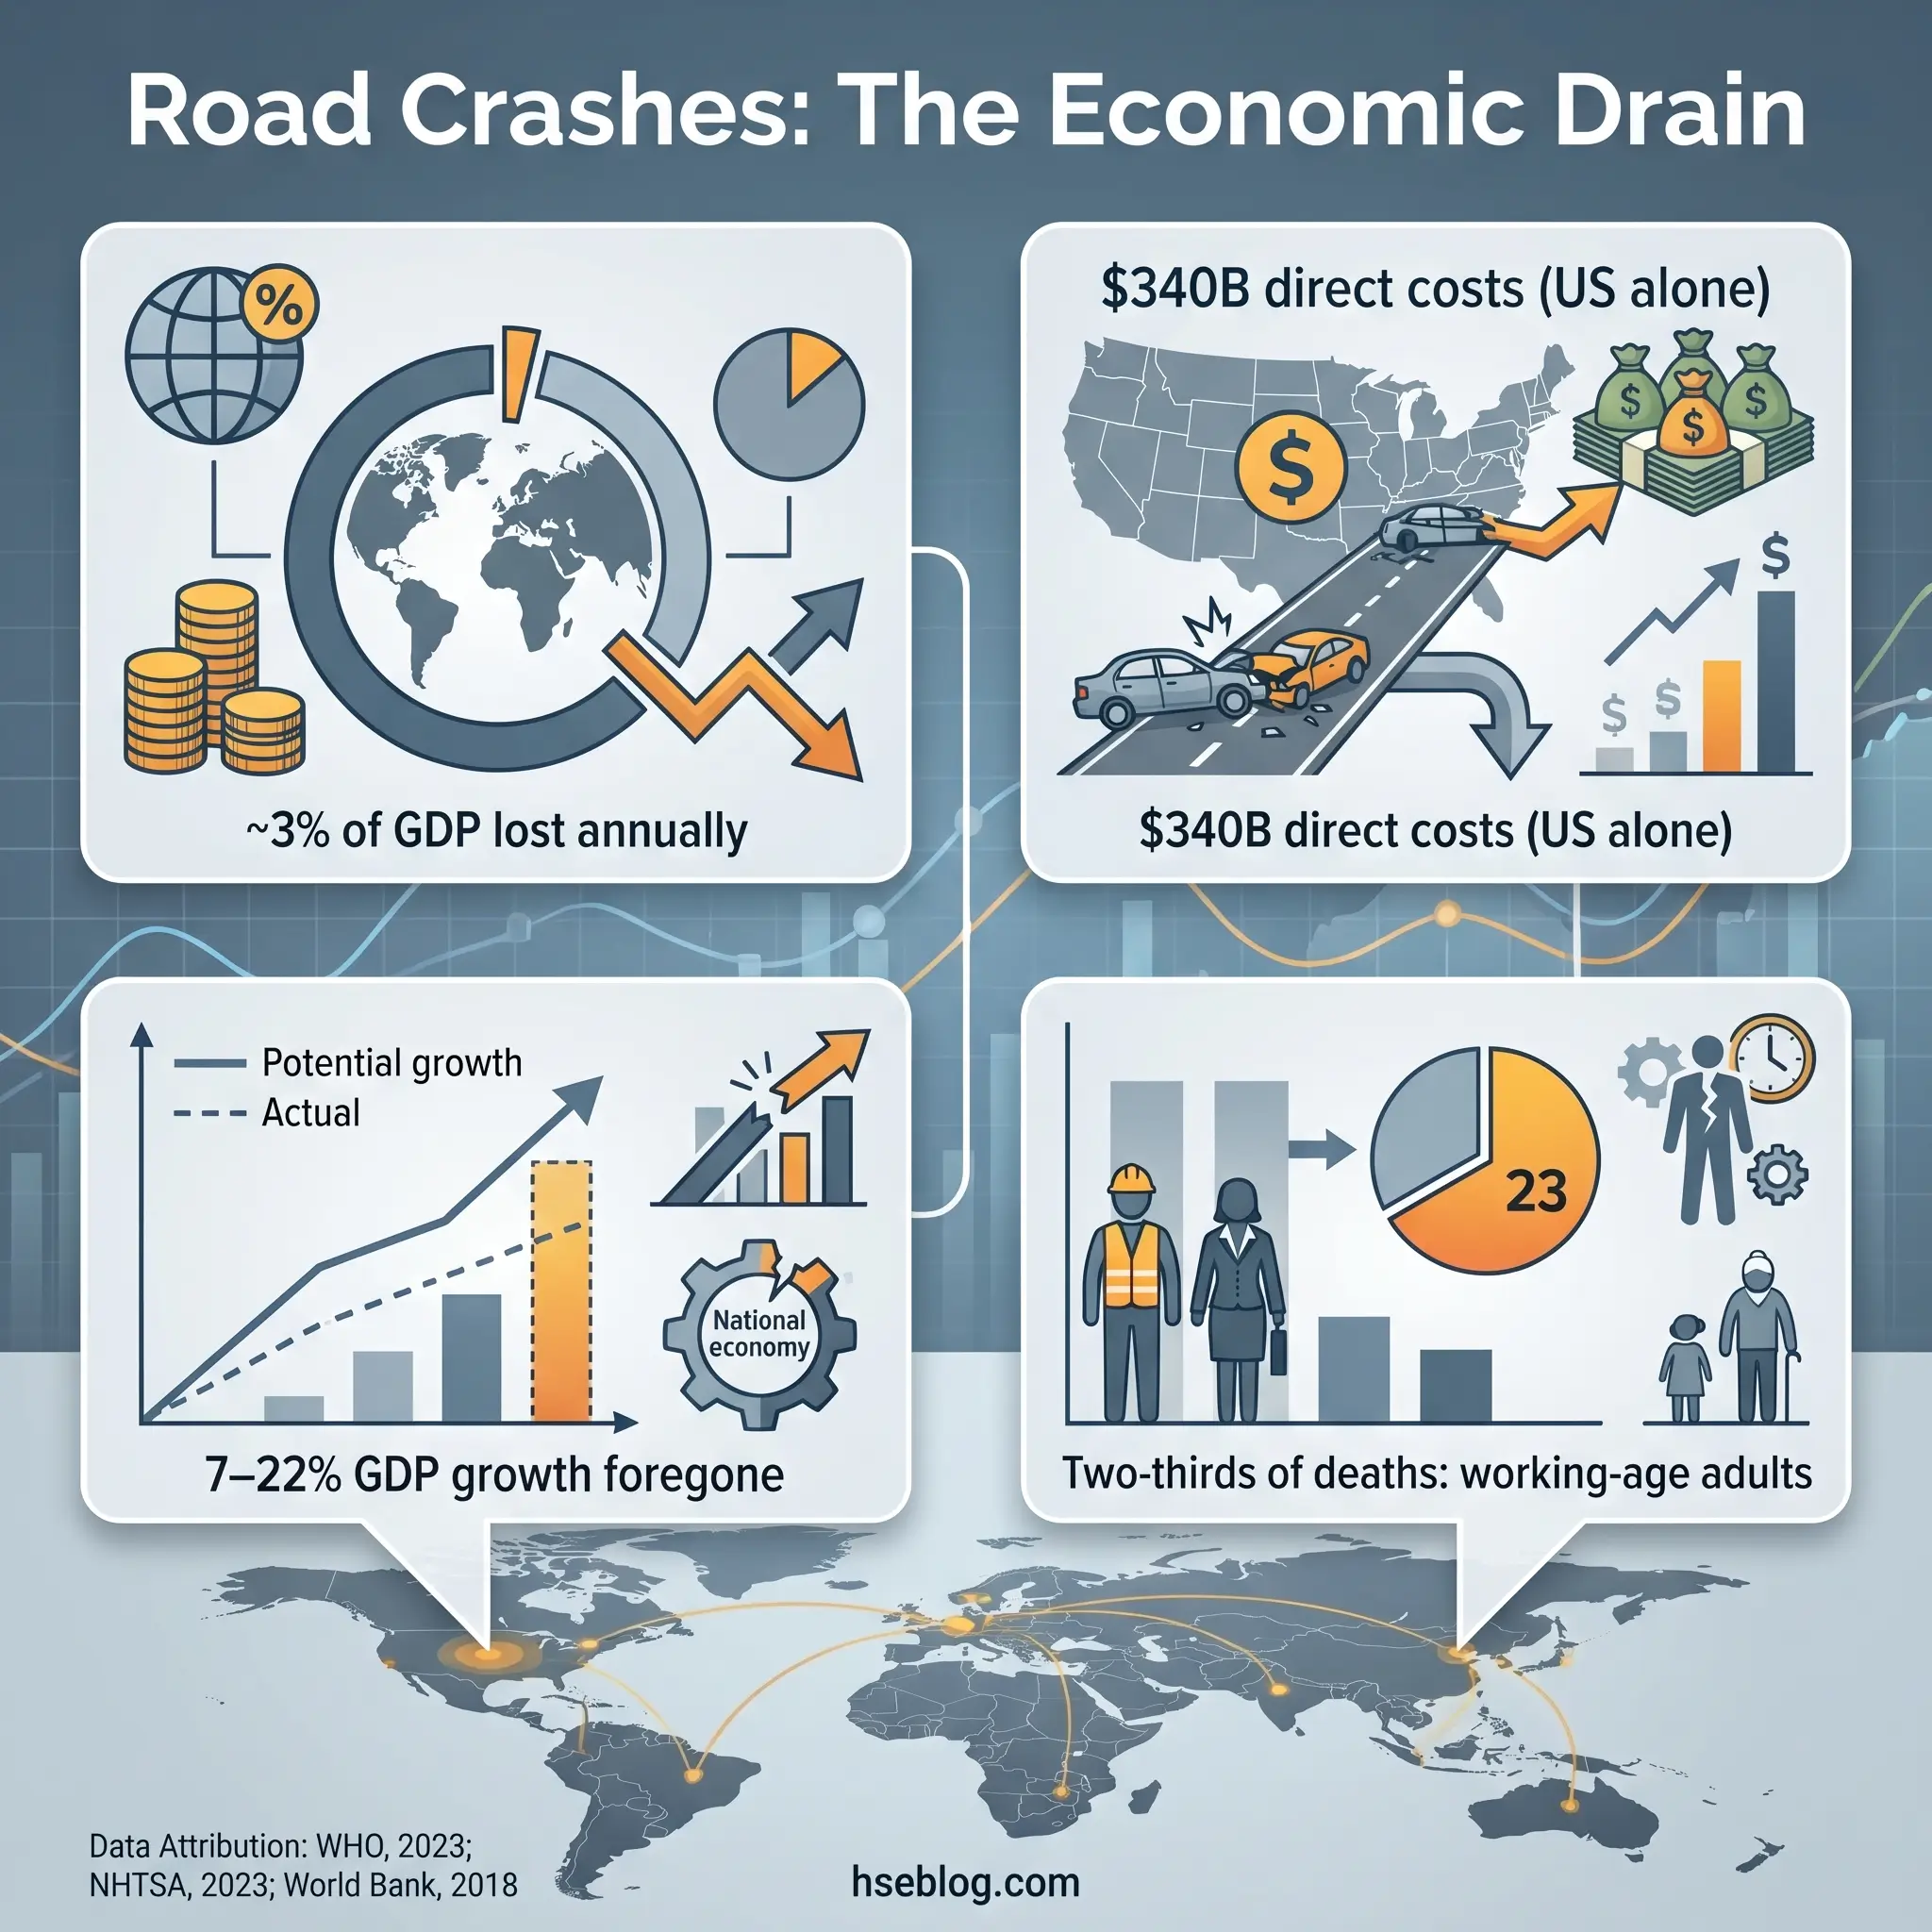
- 3% of national GDP consumed — the economic drain road crashes impose on most countries exceeds what many nations spend on education (WHO, 2023).
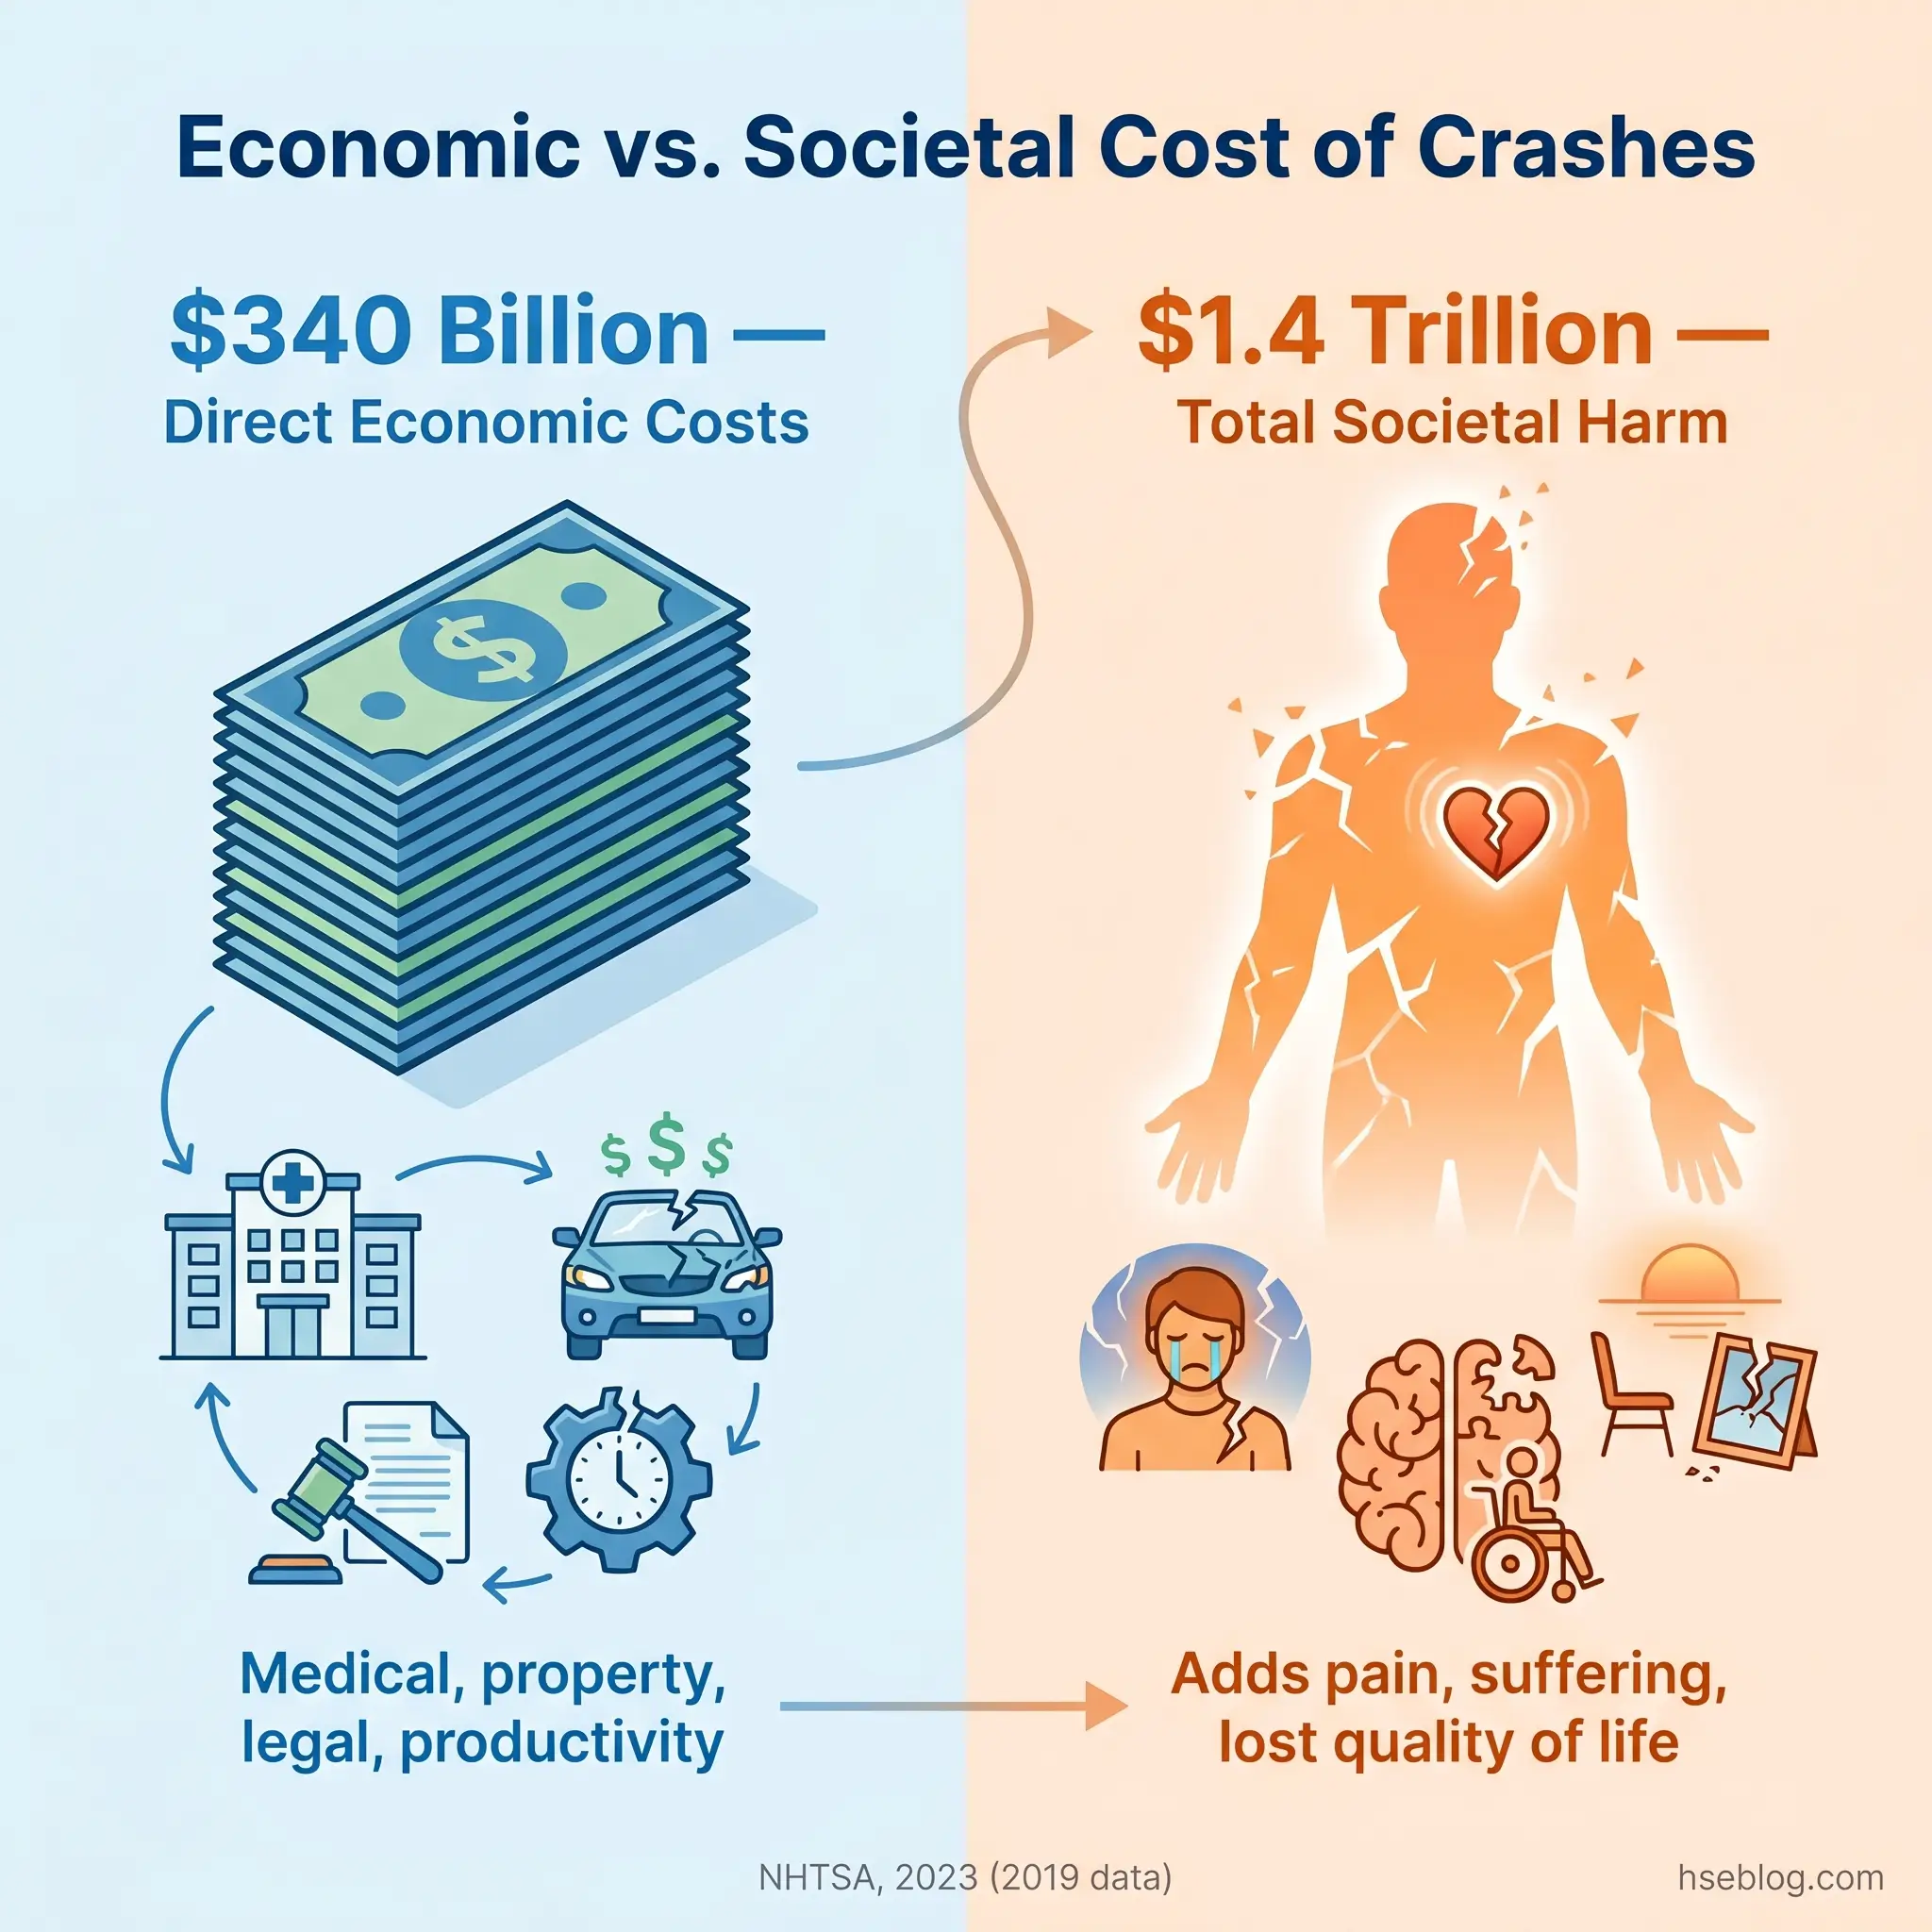
- $1.4 trillion in total societal harm — the US figure alone, once quality-of-life losses are added to direct costs (NHTSA, 2023).
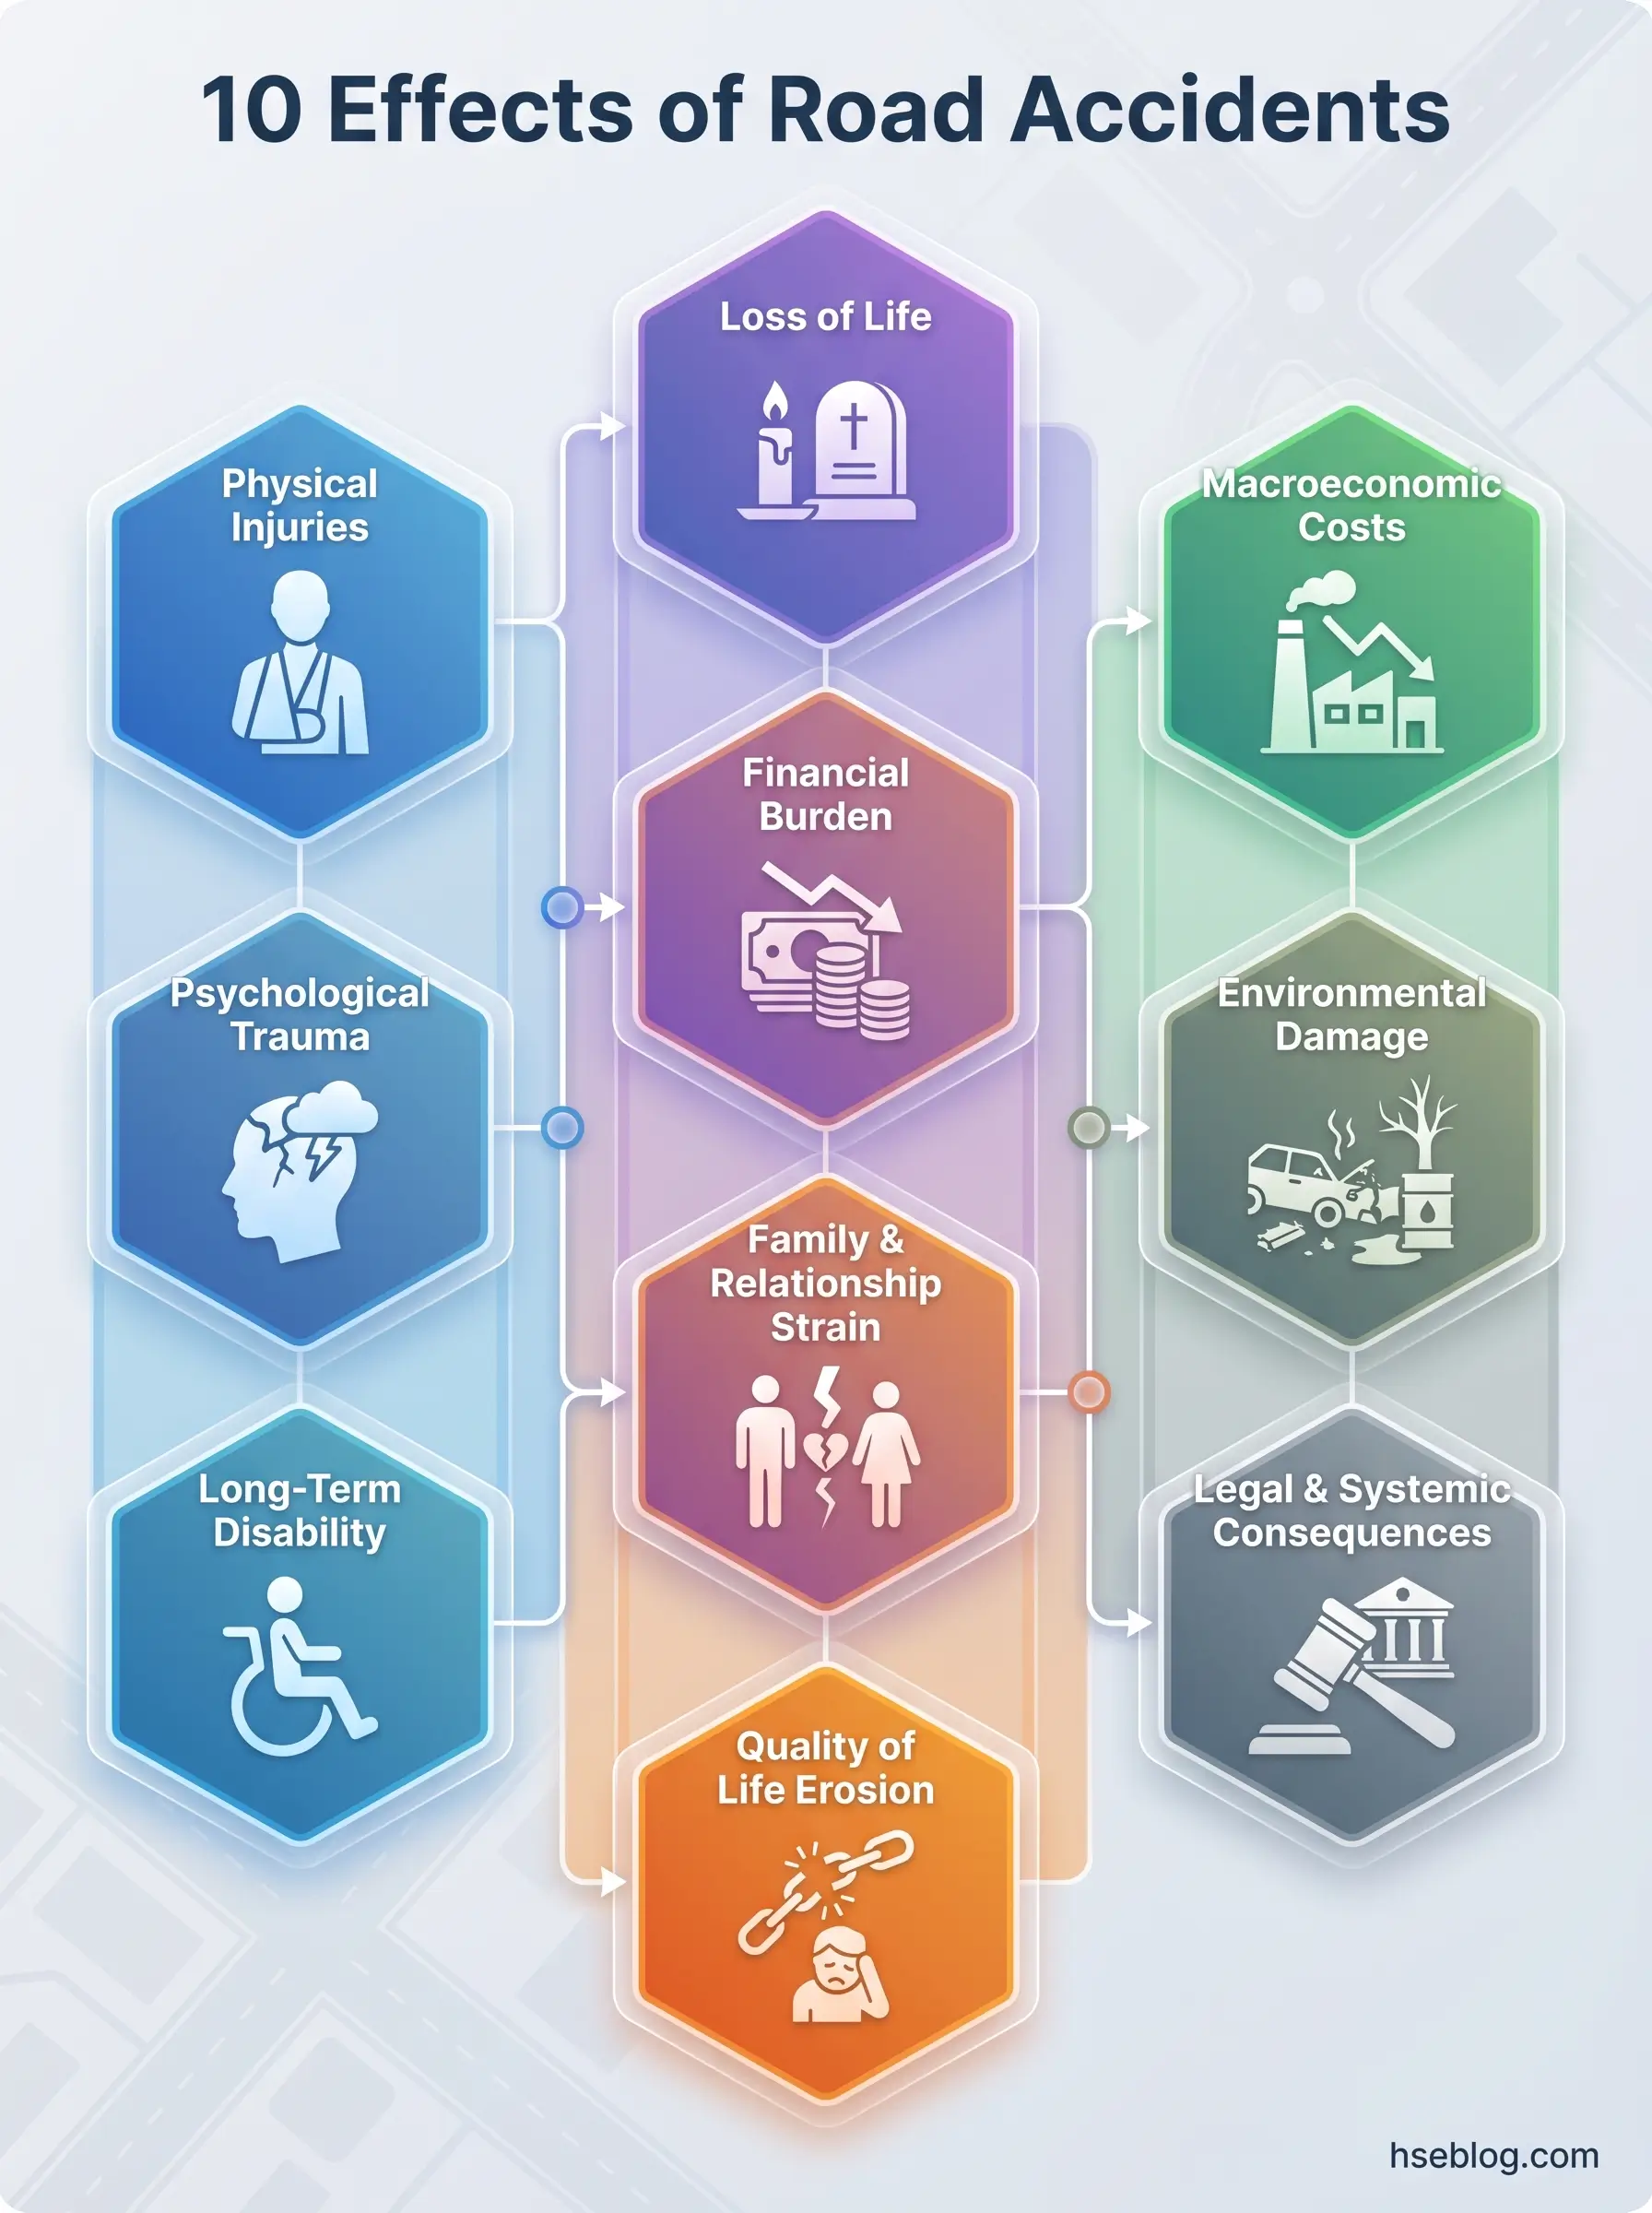
Road accidents produce 10 major categories of consequences: physical injuries, psychological trauma, loss of life, financial burden on victims and families, long-term disability, family and relationship strain, macroeconomic costs to national economies, erosion of mental health and quality of life, environmental damage from spills and debris, and legal and systemic consequences affecting courts, insurance systems, and emergency services.
This article provides general HSE and public health knowledge on road traffic crash consequences. Content covering psychological conditions such as PTSD, depression, and anxiety is for educational reference — it is not medical advice. Individuals experiencing symptoms after a road accident should consult a qualified medical or mental health professional.
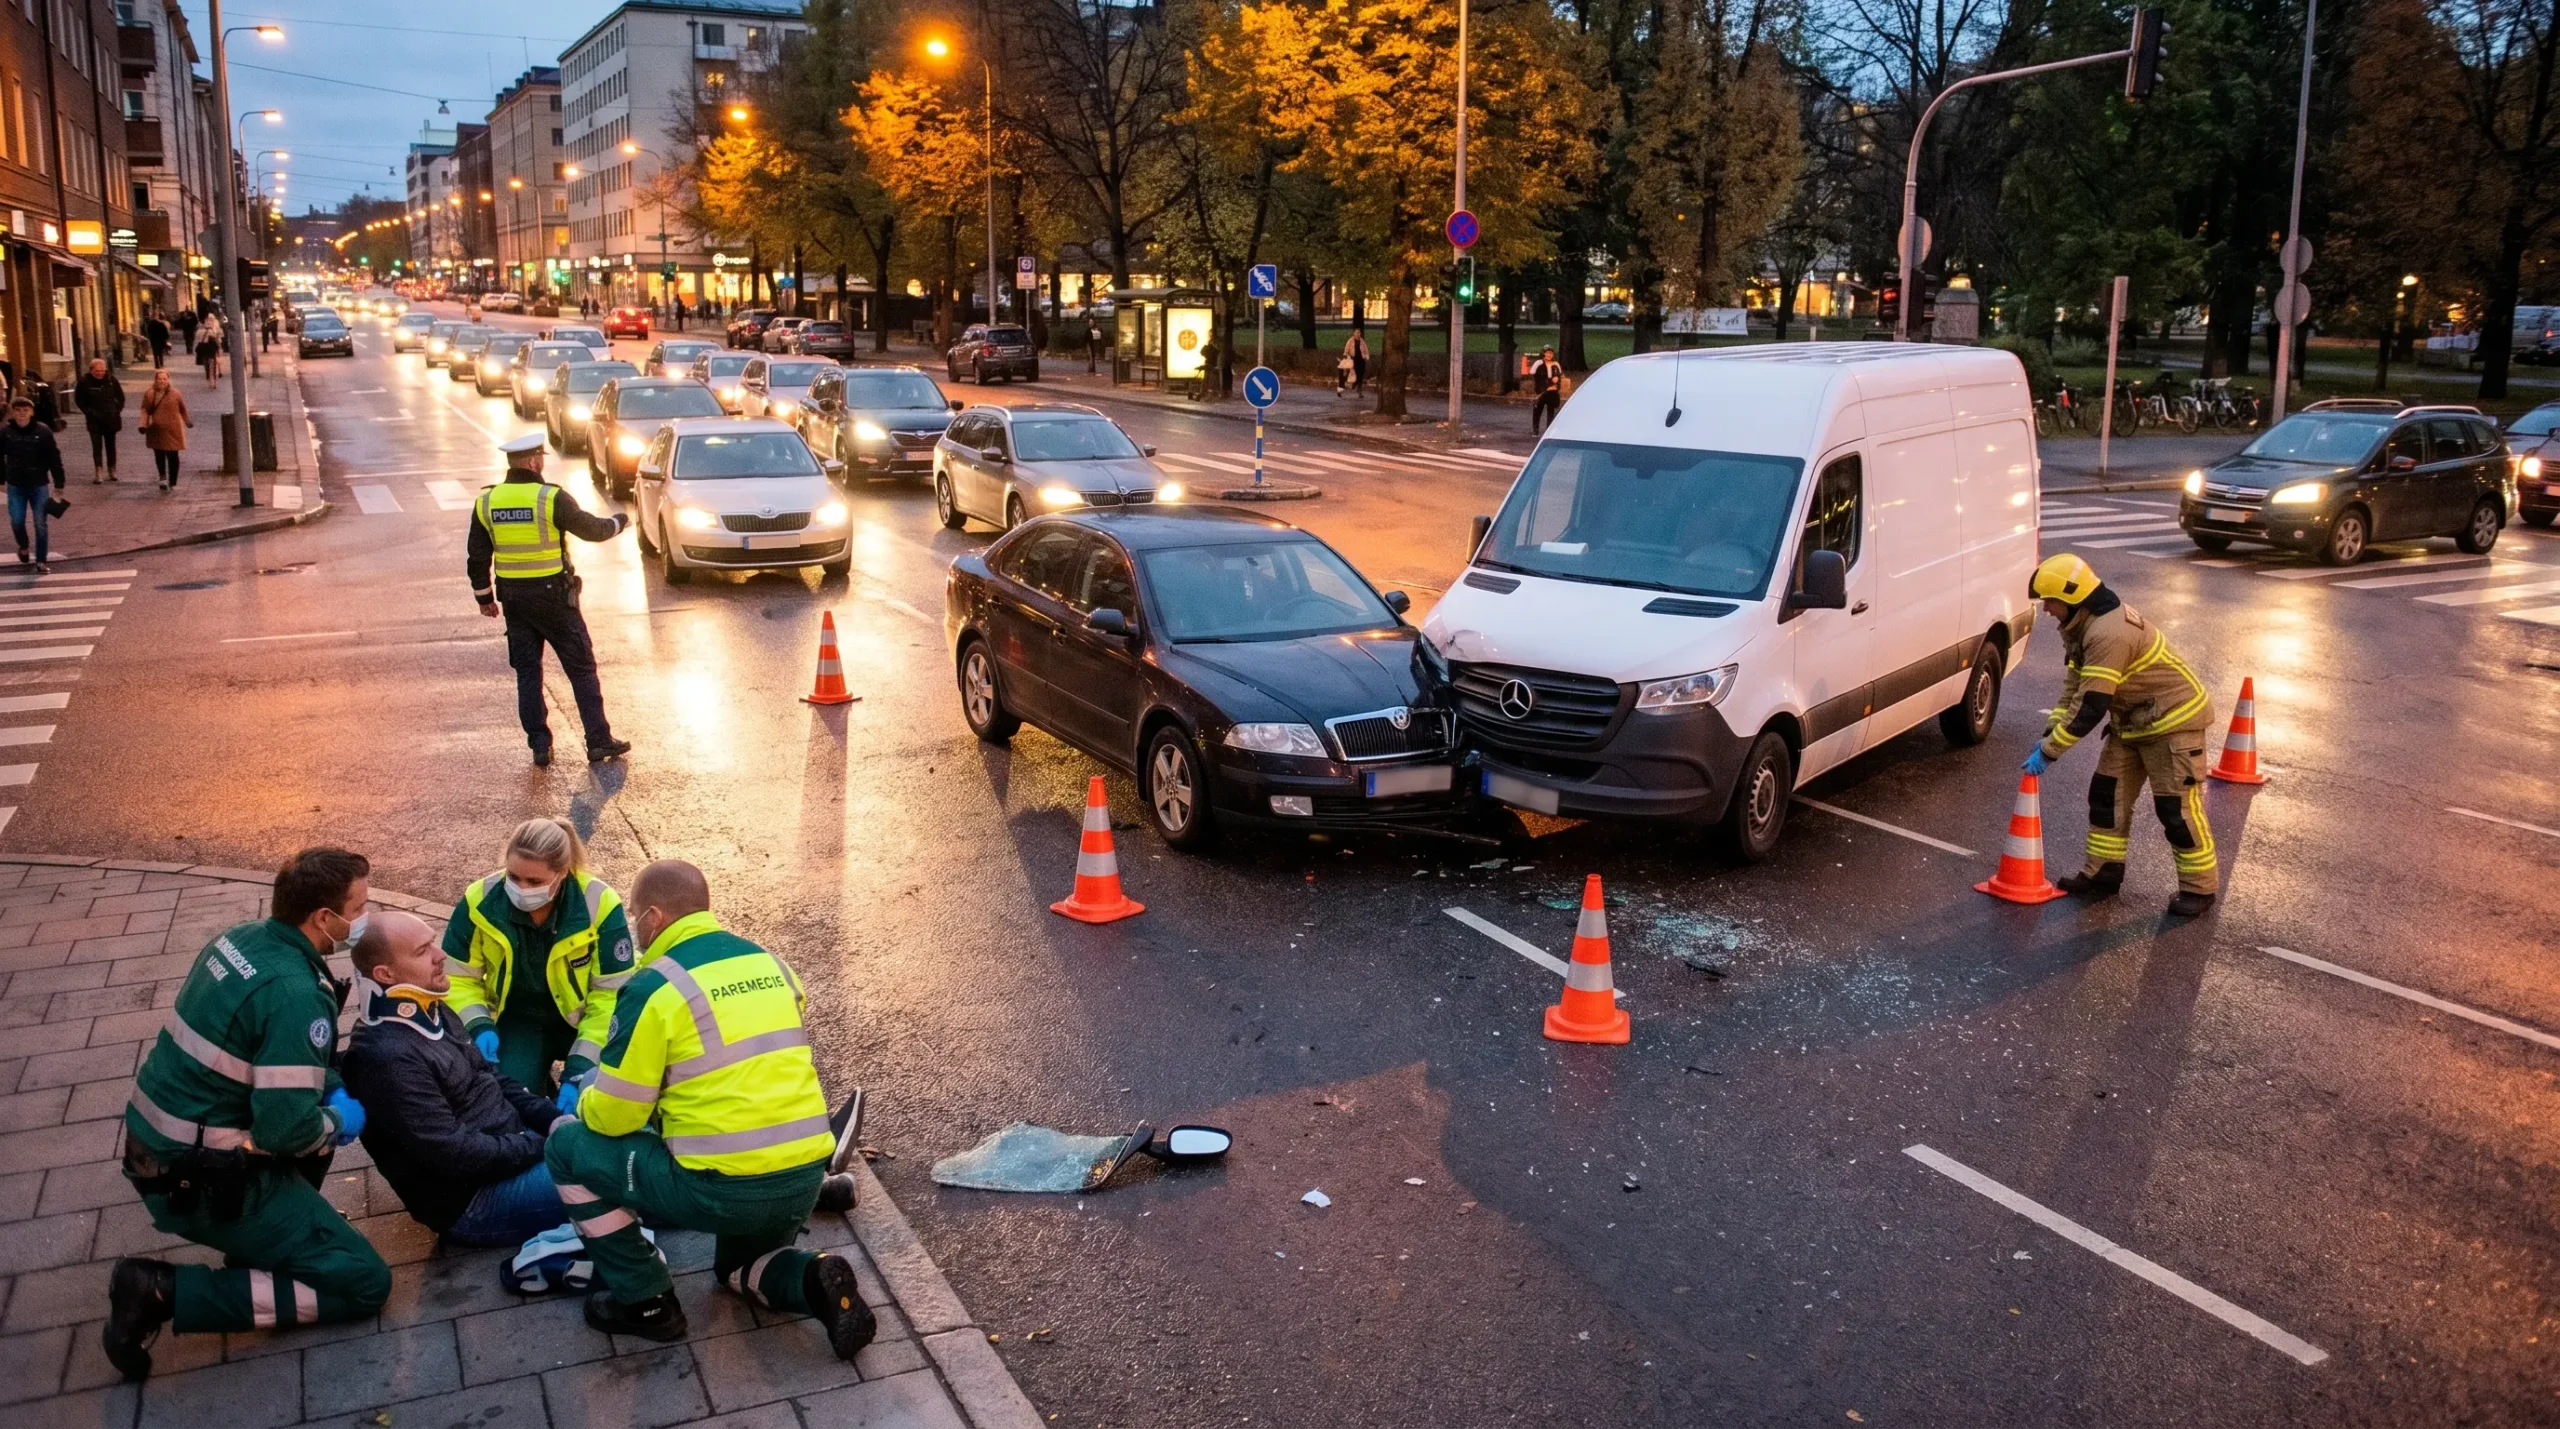
Every year, 1.19 million people are killed in road traffic crashes worldwide, and between 20 and 50 million more sustain non-fatal injuries — many resulting in permanent disability (WHO, 2023). That single pair of figures, drawn from the WHO’s Global Status Report on Road Safety, represents the largest unnatural cause of death for children and young adults aged 5–29 on the planet. Yet the wreckage visible at the crash scene — twisted metal, shattered glass, emergency lights — accounts for only the first seconds of a consequence chain that extends across years, families, healthcare systems, national economies, and ecosystems.
What road safety professionals consistently observe is that the non-physical consequences of crashes are systematically underestimated. Financial ruin, family breakdown, chronic psychological conditions, environmental contamination — these unfold over months and years, long after the news coverage ends and the road is reopened. This article examines 10 distinct categories of impact that road accidents produce, each backed by WHO, NHTSA, World Bank, and peer-reviewed research. The categories are structured to avoid the overlap that weakens most treatments of this subject: psychological trauma and long-term quality-of-life erosion, for example, are separate and non-duplicating sections, because they describe genuinely different mechanisms of harm.
1. Physical Injuries and Bodily Harm
The spectrum of physical injuries from road crashes runs from soft tissue bruising that heals within weeks to catastrophic damage — traumatic brain injury, spinal cord fractures, internal organ rupture, severe burns, limb amputation — that permanently alters a person’s physiology. What separates road trauma from many other injury mechanisms is the sheer kinetic energy involved: WHO data confirms that every 1% increase in mean speed produces a 4% increase in the risk of a fatal crash (WHO, 2023). That exponential relationship between speed and severity explains why crashes that occur at seemingly moderate speeds still produce devastating outcomes.
Physical injuries from road crashes fall into broad categories that determine both immediate treatment and long-term prognosis:
- Soft tissue and musculoskeletal injuries — lacerations, contusions, sprains, and fractures. Common, often underestimated in severity at the scene due to adrenaline masking pain.
- Traumatic brain injury (TBI) — ranges from concussion to diffuse axonal injury. Cognitive, behavioral, and personality changes may emerge gradually over weeks.
- Spinal cord injury — potential for paraplegia or quadriplegia depending on the level and completeness of the lesion.
- Internal organ damage — splenic rupture, liver laceration, pneumothorax. May not present immediately, making delayed diagnosis a persistent clinical risk.
- Burns and amputations — associated with vehicle fires, entrapment, and high-energy collisions with heavy vehicles.
A failure mode that first responders and road safety professionals consistently identify is delayed medical attention caused by adrenaline-mediated pain suppression. Victims walk away from the scene feeling functional, only to present hours or days later with injuries — whiplash-associated disorders, internal bleeding, undiagnosed fractures — that have worsened because of the delay. This pattern is not an edge case; it is a routine feature of road trauma that complicates accurate injury surveillance.
2. Psychological and Emotional Trauma
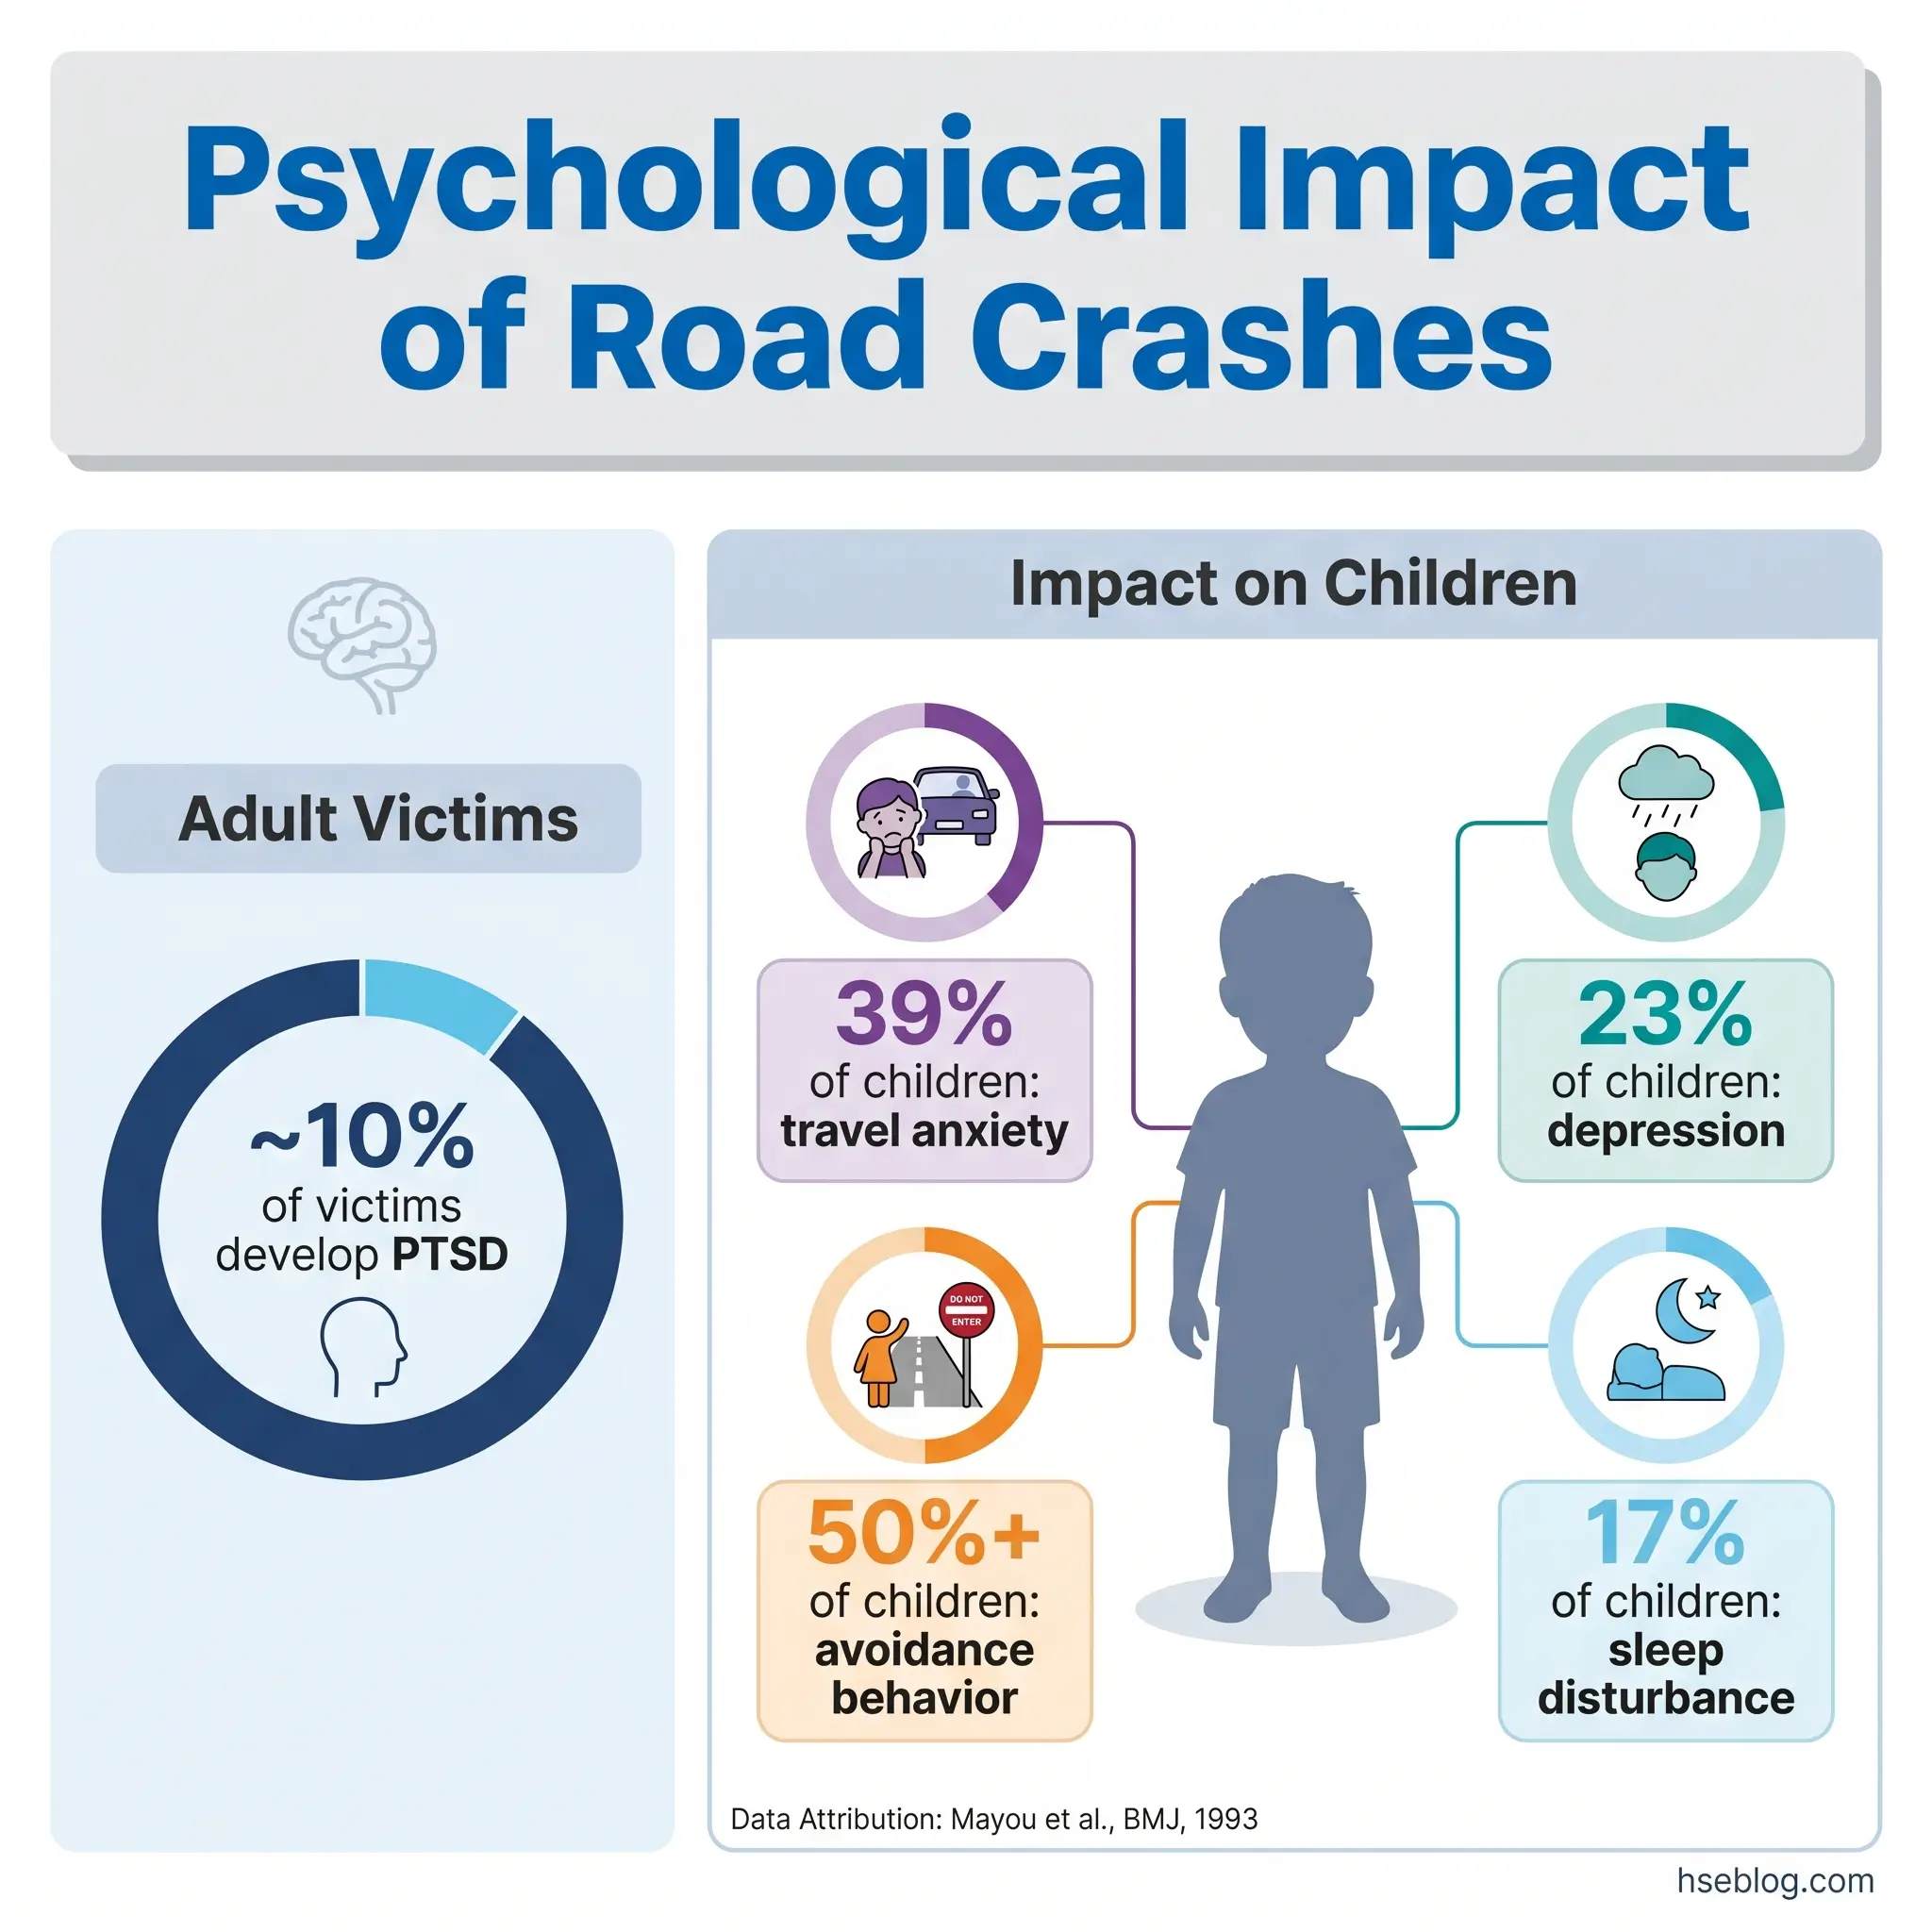
Approximately one-tenth of road accident victims develop clinically diagnosable PTSD, and a larger proportion experience phobic travel anxiety — a specific, disabling fear of driving or riding as a passenger (Mayou et al., BMJ, 1993). These are not transient stress reactions. The peer-reviewed follow-up study published in the BMJ found that acute stress syndromes characterized by mood disturbance, intrusive memories, and horrific recollections of the crash were strongly predictive of long-term psychiatric consequences of road traffic accidents.
Several distinct psychological conditions emerge after road crashes, and conflating them — as many treatments of this topic do — obscures the different mechanisms and different intervention needs:
- PTSD — intrusive re-experiencing, avoidance behavior, hyperarousal. Onset may be delayed by weeks.
- Acute stress disorder — immediate-onset distress with dissociation, anxiety, and mood disturbance in the days following the crash.
- Phobic travel anxiety — distinct from generalized anxiety. The victim specifically avoids vehicles, roads, or travel contexts. This condition can persist for years and effectively restricts the person’s employment, social participation, and independence.
- Depression — often secondary to pain, disability, and loss of function, but also a primary consequence of the traumatic event itself.
- Grief and bereavement disorders — when the crash involved fatalities, survivors may experience complicated grief alongside their own trauma.
One finding from the Mayou research that challenges common assumptions: brief loss of consciousness during the crash may actually be protective against PTSD, because amnesia for the event reduces the formation of the vivid horrific memories that drive post-traumatic re-experiencing. This runs counter to the intuition that unconsciousness signals worse outcomes.
Watch For: Psychological screening after road accidents remains inconsistent globally. Many victims receive excellent orthopaedic or surgical care but no structured psychological assessment. PTSD and travel anxiety go unrecognized — and untreated — for years. Any road safety or occupational health professional involved in post-crash care should advocate for standardized psychological screening at the point of discharge and at three months.
Psychological Impact on Children
Children involved in or witnessing road accidents show distinct vulnerability patterns. Research indicates travel anxiety in 39% of child road accident victims, avoidance behaviors in over 50%, depression in approximately 23%, and sleep disturbances in 17% (Mayou et al., BMJ, 1993). Younger children and those whose parent was also involved in the crash are at highest risk. An additional layer of harm emerges from parental response: increased protectiveness and restriction of the child’s independence can itself create secondary conflict and developmental limitation.
3. Loss of Life and Bereavement
Road traffic injuries are the leading cause of death for people aged 5–29 globally, and 92% of those fatalities occur in low- and middle-income countries — nations that hold roughly 60% of the world’s registered vehicles (WHO, 2023). That disproportion reveals a systemic failure: the countries least equipped to absorb the economic and social shock of road deaths are the ones bearing the overwhelming majority of them.
The nature of death in road crashes — sudden, violent, without warning — produces a bereavement pattern distinct from anticipated death. Families receive no preparation, no opportunity to say goodbye, no gradual adjustment. Research on traumatic bereavement consistently shows that sudden death carries a higher risk of complicated grief, prolonged psychological distress, and difficulty in adjustment compared to deaths preceded by illness.
The human multiplication effect is one of the most important — and most invisible — dimensions of road fatality data. Statistics count individual deaths. But each death radiates outward: surviving dependents lose income, children lose a parent, a household loses its primary earner. In low-income contexts, where single-income households are common and social safety nets are minimal, the death of an adult wage earner can trigger school dropout for children, housing loss, and generational poverty. No headline figure captures that multiplication, and road safety policy that focuses solely on reducing the death count without addressing the per-death ripple underestimates the true human cost by an order of magnitude.
4. Financial and Economic Burden on Victims and Families
The financial architecture of a road crash extends far beyond the visible damage. Direct costs include emergency treatment, hospitalization, surgery, rehabilitation, medication, prosthetics, and home modification. Indirect costs — often larger — include lost wages during recovery, permanently reduced earning capacity from disability, the economic value of unpaid caregiving by family members, and legal fees. Property damage and increased insurance premiums add further layers.
In the United States, motor vehicle crashes cost $340 billion in direct economic costs in 2019, equivalent to approximately $1,035 per person (NHTSA, 2023). When quality-of-life valuations — pain, suffering, loss of function — are included, the total societal harm reached nearly $1.4 trillion (NHTSA economic impact study). These are US-specific figures; the global picture, while harder to quantify precisely, is proportionally larger.
The burden falls hardest on those least able to absorb it. Research from the World Bank has documented cases in low-income settings where the annual mean cost of a road accident to a poor household represented 183% of its annual income (World Bank, 2018). That figure means the crash doesn’t just strain the household — it collapses it financially, often permanently.
The Fix That Works: Financial counseling is almost never integrated into post-crash care pathways, despite financial stress being a documented driver of poor psychological recovery outcomes. Embedding a financial support referral into the hospital discharge process — similar to the way social work referrals are triggered for domestic violence cases — would address a gap that currently undermines recovery for thousands of crash victims annually.
5. Long-Term Disability and Reduced Mobility
Between 20 and 50 million people sustain non-fatal road traffic injuries each year, and a significant proportion of them face permanent disability (WHO, 2023). This section addresses what happens after the acute injury is treated — the long arc of disability that follows, and the systemic gaps that make it worse.
Spinal cord injuries from road crashes can result in paraplegia or quadriplegia, depending on the vertebral level and completeness of the lesion. Traumatic brain injury may leave survivors with cognitive deficits, behavioral changes, or personality alterations that are invisible to casual observation but profoundly disabling in daily life. Amputations require prosthetic fitting, gait retraining, and ongoing adjustment as residual limbs change over time. Each of these conditions demands a rehabilitation trajectory measured in months and years, not the days or weeks of a hospital stay.
The critical failure mode is the gap between medical discharge and true functional recovery. Hospital discharge is often treated — by institutions, insurers, and even families — as the endpoint of care. In reality, the patient faces an “invisible phase” of disability: months of physiotherapy, vocational retraining, home modification, assistive technology acquisition, and psychological adaptation to a changed body and changed capabilities. Health systems in most countries handle this transition poorly, with fragmented referral pathways and limited funding for community-based rehabilitation.
Disability from road crashes also interacts with accessibility infrastructure. A wheelchair user discharged into a community with inaccessible public transport, stepped building entries, and no employer accommodation faces a compounding barrier that goes far beyond the original injury. The road crash produced the disability; the built environment determines whether that disability becomes exclusion.
6. Impact on Families, Relationships, and Caregivers
When a serious road crash injures one family member, the entire household system absorbs the shock. Roles reverse: children may become caregivers, a working spouse may leave employment to provide full-time care, and the injured person transitions from provider or partner to dependent. These shifts are not temporary adjustments — in cases of permanent disability, they become the new structure of the family.
The evidence on marital and relationship strain after serious injury is consistent: the combination of financial pressure, role disruption, caregiver exhaustion, and the injured person’s psychological changes (irritability, depression, personality shifts from TBI) significantly elevates the risk of separation and divorce. Children in these families show measurable effects — declining school performance, behavioral changes, anxiety, and in some cases a pattern called parentification, where the child takes on emotional or practical responsibilities beyond their developmental stage.
Social isolation compounds the strain. Both victims and caregivers report shrinking social networks. Friends and extended family may offer initial support that fades over weeks. The caregiver, in particular, occupies an invisible role — providing daily physical assistance, managing medical appointments, advocating with insurers and employers — without any structured support system of their own.
Audit Point: Rehabilitation services that focus entirely on the patient while offering no structured support to the primary caregiver are operating with a known gap. Caregiver burnout is not a secondary concern — it directly undermines the patient’s recovery trajectory. Family-centered rehabilitation models that include caregiver assessment, respite provision, and psychological support produce better outcomes for all parties.
7. Macroeconomic and National Economic Consequences
WHO estimates that road traffic crashes cost most countries approximately 3% of their gross domestic product (WHO, 2023). That figure, staggering on its own, becomes more meaningful in context: many countries spend less than 3% of GDP on their entire education system. The economic drain from road crashes silently competes with — and in some cases exceeds — national investment in human development.
The World Bank has quantified the growth cost of inaction: countries that fail to invest in road safety could miss 7–22% of potential per capita GDP growth over a 24-year period, and a 10% reduction in road deaths is associated with a 3.6% increase in per capita GDP over 24 years (World Bank, 2018). These figures frame road safety not as a cost center but as an economic investment with a measurable return — one of the highest returns of any public health intervention.
In the US, the NHTSA’s April 2025 early estimate shows 39,345 traffic fatalities in 2024 — a 3.8% decrease from 2023, but still 8% above pre-pandemic 2019 levels (NHTSA, 2025). Adjusted for inflation, the total societal cost of US crashes reaches approximately $1.77 trillion in 2025 dollars. Working-age adults between 18 and 59 account for roughly two-thirds of road fatalities, which means the workforce productivity loss is concentrated in the most economically active segment of the population.
The reason road safety remains chronically underfunded despite these numbers is structural. The costs of road crashes are distributed across healthcare budgets, insurance systems, welfare programs, justice systems, and infrastructure maintenance. No single ministry or department owns the full cost line, so no single ministry champions the full investment case. Road safety competes for attention in every budget cycle and wins in none — a governance failure that the Marrakech Declaration of February 2025 explicitly sought to address by calling on governments from 100 countries to treat road safety as a political priority with sustained, dedicated funding (WHO, 2025).
8. Impact on Mental Health and Quality of Life
The distinction between acute psychological trauma (covered in Section 2) and long-term quality-of-life erosion matters because the mechanisms are different and the interventions required are different. PTSD is a diagnosable psychiatric condition with evidence-based treatments. Quality-of-life erosion, by contrast, is a slower, less clinical, and often unmeasured decline that encompasses loss of confidence, social withdrawal, inability to participate in activities that previously defined the person’s identity, and a pervasive sense of diminished living.
Loss of driving confidence — or complete refusal to drive — is specific enough to constitute a distinct functional disability in car-dependent communities. A person who cannot drive in a city without reliable public transport loses access to employment, social life, healthcare appointments, and basic errands. This single psychological consequence can restructure an entire life.
Social isolation follows from both mobility limitation and psychological withdrawal. Victims who once participated in sports, community activities, or social gatherings may stop entirely — sometimes because physical disability prevents it, sometimes because anxiety makes it unbearable, and often because both operate simultaneously. Identity disruption compounds the effect: a person whose sense of self was tied to their occupation, their physical capability, or their social role faces an existential renegotiation that clinical services rarely address.
The research finding that matters most for intervention is this: mental state at three months post-accident is highly predictive of mental state at one year (Mayou et al., BMJ, 1993). That window represents the critical point for screening and early intervention. Yet most road accident victims receive no structured psychological assessment at three months — or at any point after initial hospital discharge. This is the single largest gap in post-crash care, and closing it would change long-term outcomes for a substantial proportion of survivors.
9. Environmental Consequences of Road Accidents
Environmental damage from road crashes is a category that standard crash investigation protocols almost entirely ignore. Police reports document human casualties and property damage. Insurance assessments cover vehicle and infrastructure costs. But the ecological harm from fluid spills, debris dispersal, and vehicle fires is only formally assessed when it reaches a scale that triggers environmental regulatory thresholds — meaning routine low-level contamination from ordinary crashes goes entirely unmonitored.
The contamination pathways are straightforward and significant. A single quart of motor oil can contaminate up to 250,000 gallons of water. Multiply that by the volume of engine oil, transmission fluid, coolant, brake fluid, and fuel released in even a moderate-severity crash, and the per-incident contamination potential becomes substantial. When crashes involve commercial vehicles carrying hazardous materials — industrial chemicals, agricultural products, fuel tankers — the environmental consequences escalate to emergency-response scale.
Vehicle fires release a toxic cocktail of particulates, heavy metals, and combustion byproducts into the surrounding air and soil. Crash debris — glass, metal fragments, plastic — enters roadside ecosystems and waterways. These are acute effects. The secondary environmental burden comes from manufacturing replacement vehicles and parts, repairing damaged road infrastructure (asphalt production is carbon-intensive), and operating the heavy equipment required for barrier replacement and road resurfacing.
None of these environmental costs appear in the standard economic calculations of crash impact. WHO’s 3% GDP figure and NHTSA’s $340 billion estimate do not include environmental remediation or ecological damage. The true cost of road accidents is higher than any published figure captures, because the environmental dimension is systematically excluded from the accounting.
10. Legal, Insurance, and Systemic Consequences
The content in this section is educational and reflects general understanding of legal processes across jurisdictions. It is not legal advice. Specific questions about liability, claims, criminal charges, or insurance disputes should be directed to qualified legal counsel in the applicable jurisdiction.
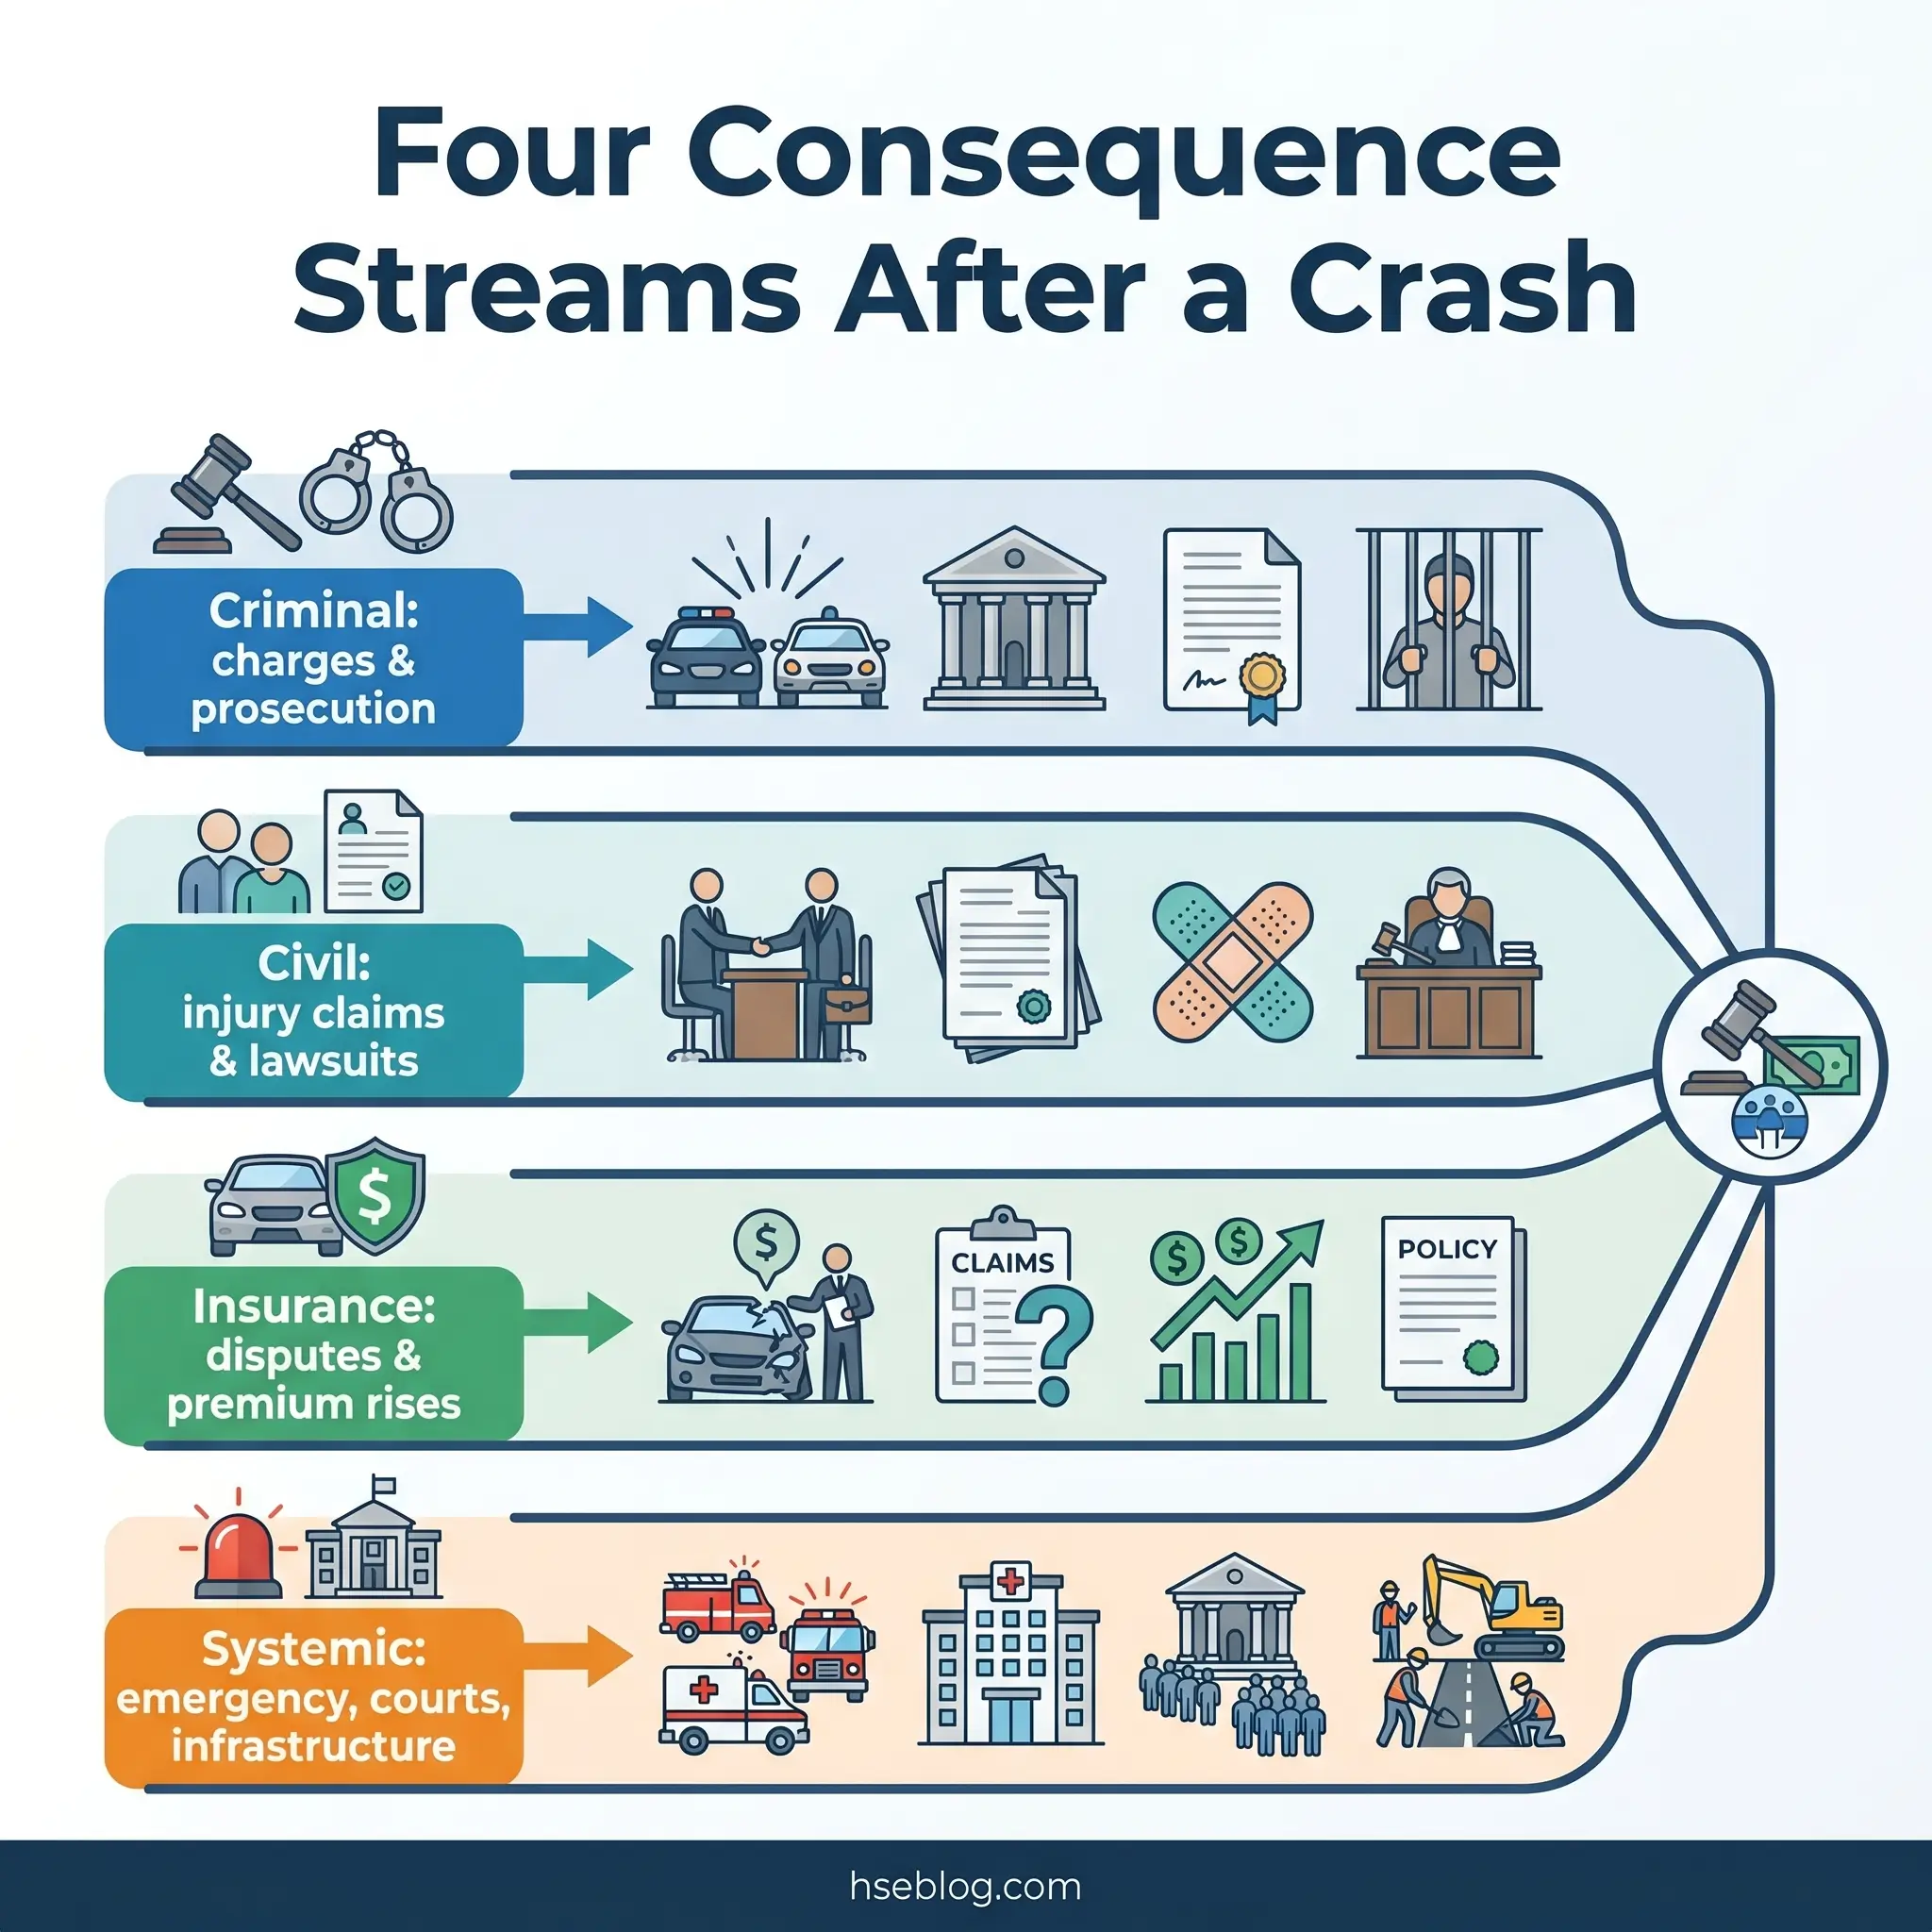
The legal aftermath of a road crash operates across criminal, civil, and regulatory domains simultaneously, and the jurisdictional variation is substantial. Criminal liability ranges from dangerous driving charges and driving under the influence prosecution to vehicular manslaughter — with penalties, definitions, and burden-of-proof standards differing by country and, in federal systems, by state or province. Civil litigation encompasses personal injury claims, wrongful death suits, and product liability actions where vehicle defects contributed to the crash.
Insurance processes add a further layer of complexity. Premium increases following at-fault crashes are immediate and long-lasting. Coverage disputes — over policy limits, exclusions, pre-existing conditions, and subrogation rights — can extend for years. In jurisdictions without universal healthcare, inadequate insurance coverage can convert a survivable injury into a financial catastrophe.
The systemic load on public services is rarely aggregated but consistently heavy. Emergency services — police, fire, ambulance, air rescue — are diverted from other duties for every crash response. Trauma wards absorb surgical and intensive-care resources. Court systems process road traffic cases as a significant proportion of their civil litigation caseload. Infrastructure repair budgets are consumed by barrier replacement, road resurfacing, and signal repair.
The practitioner observation that matters here is that the legal process itself becomes a secondary source of harm for victims. Insurance disputes, adversarial litigation, repeated medical examinations arranged by opposing counsel, and delays in compensation settlement extend psychological distress for years beyond the crash. Clinical treatment plans for crash victims rarely account for the independent psychological burden of ongoing legal proceedings — another gap where road safety, healthcare, and justice systems fail to coordinate.
What Can Be Done to Prevent Road Accidents and Reduce Their Impact?
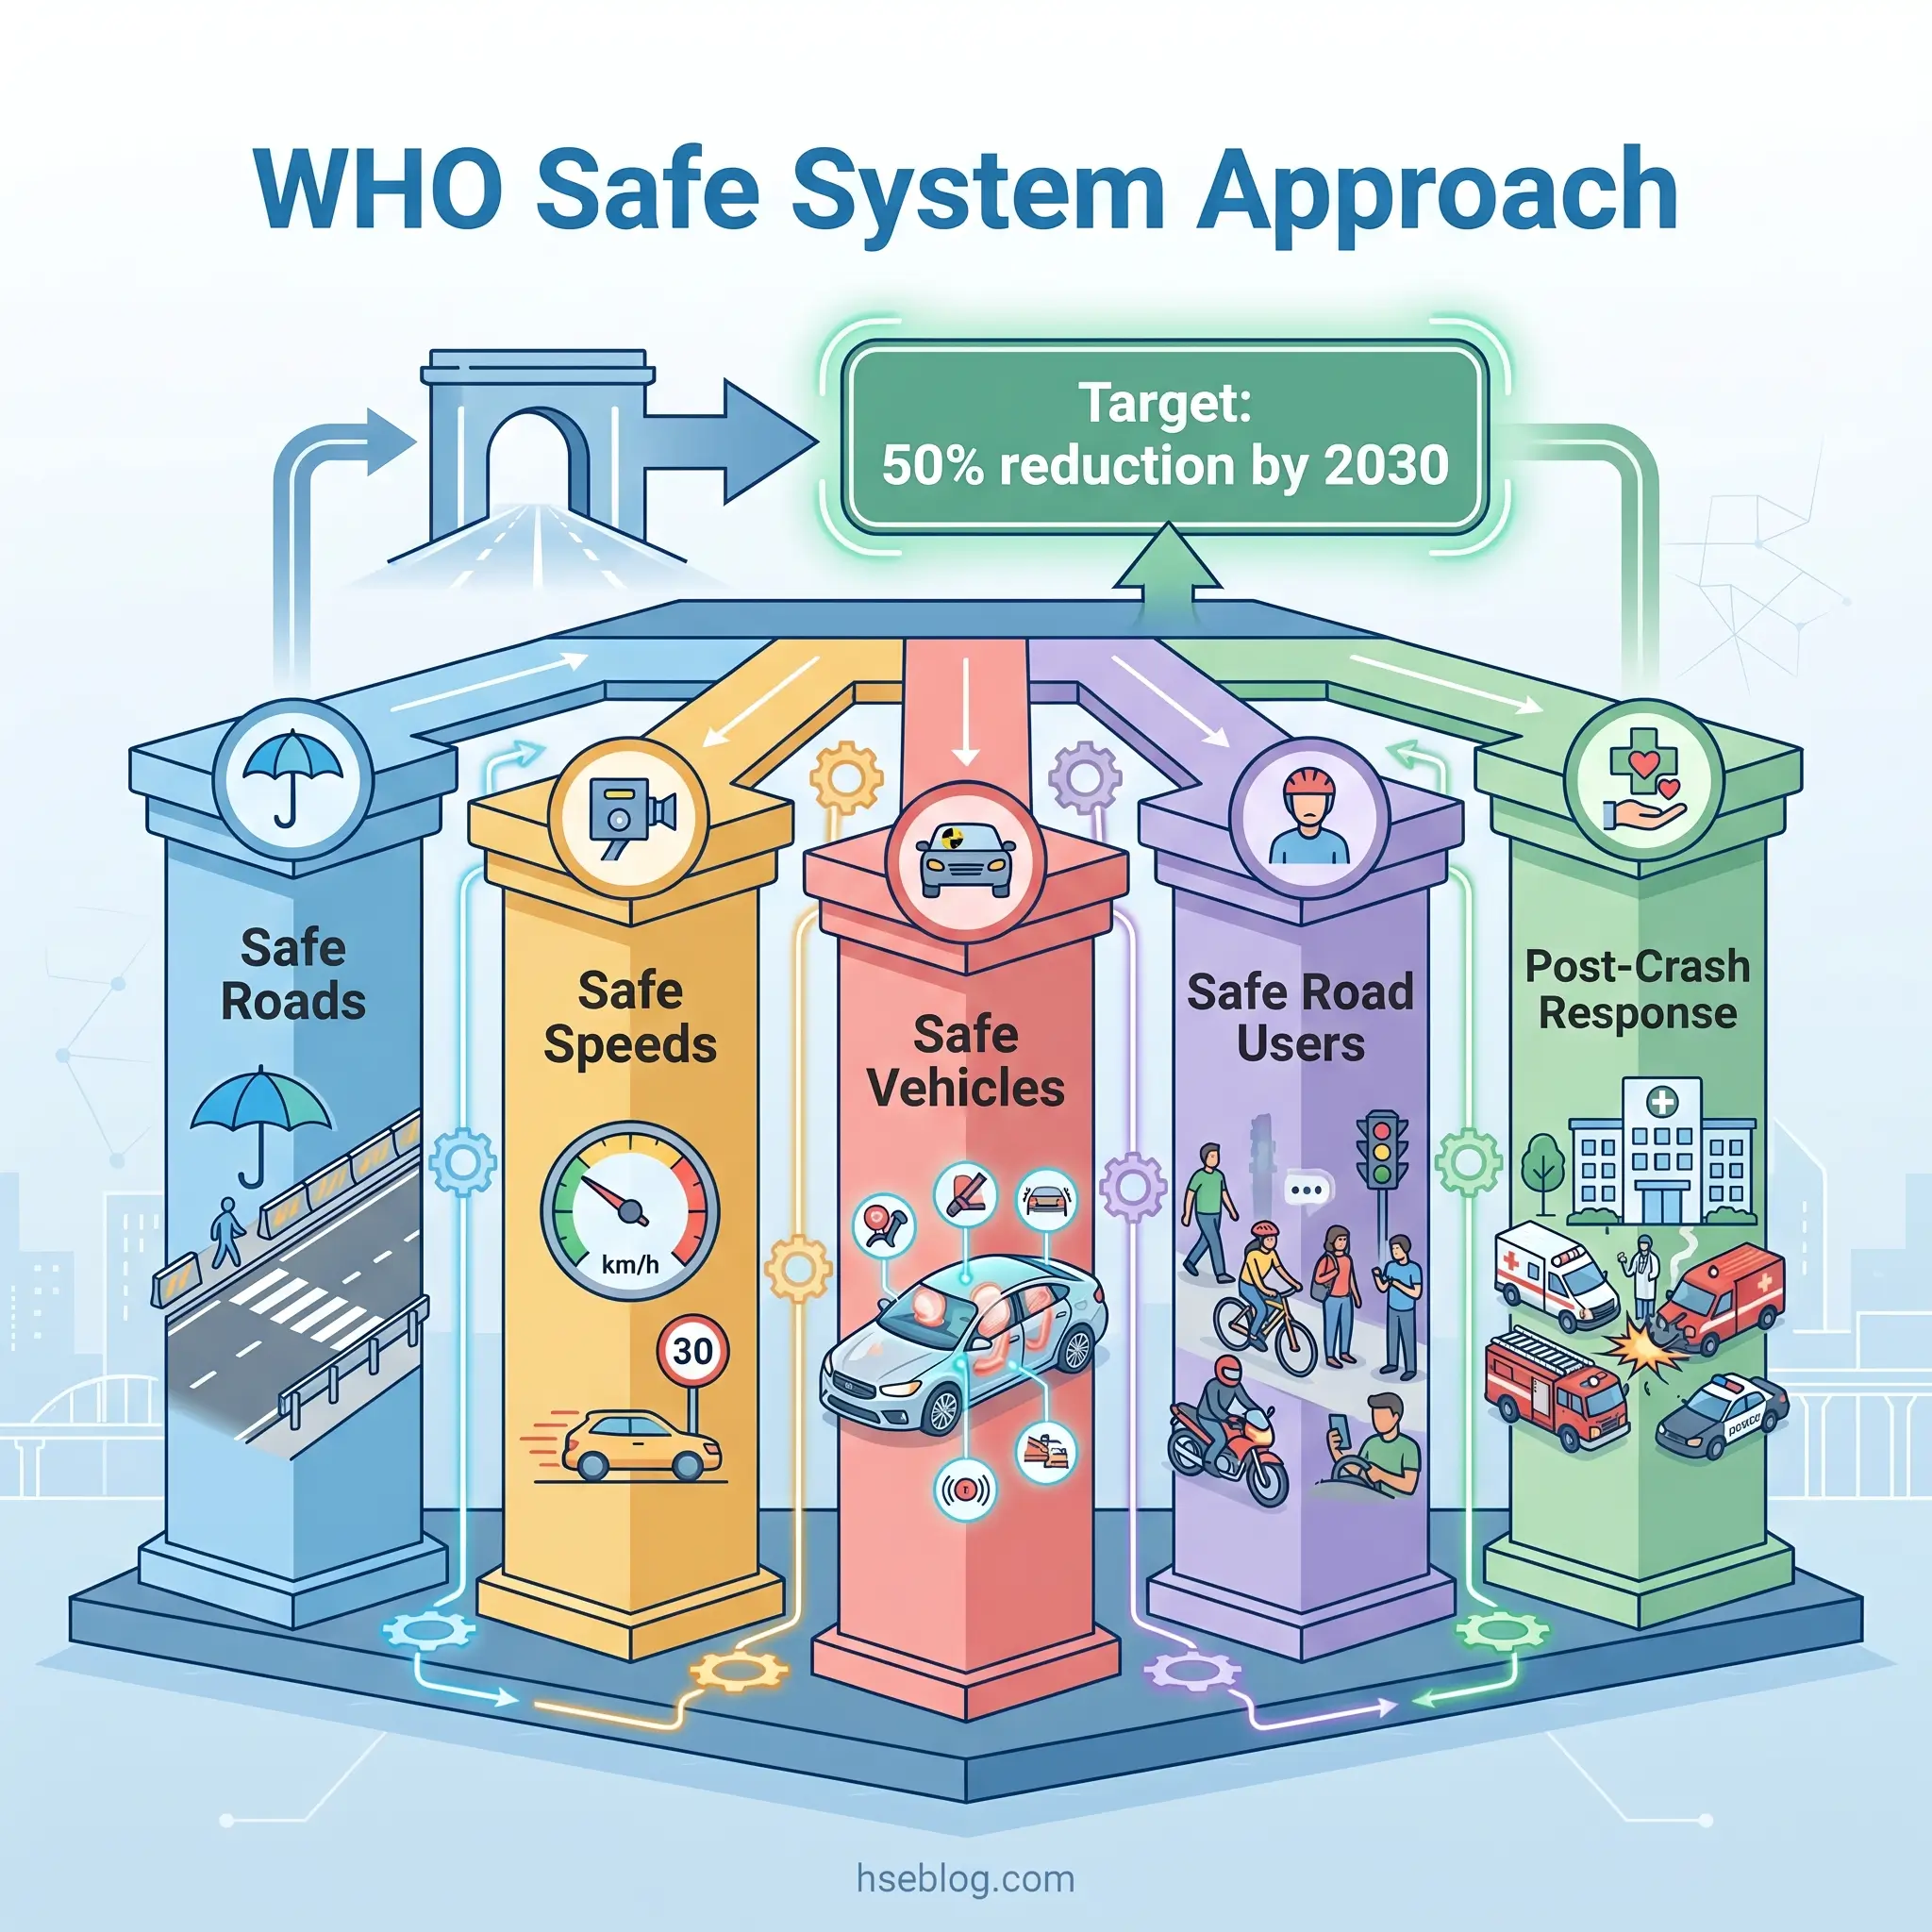
The most effective road safety strategies do not rely solely on changing driver behavior. The core paradigm shift in modern road safety thinking — embodied in WHO’s Safe System Approach — accepts that humans will always make errors and designs the system to prevent those errors from being fatal. The five pillars are safe roads (forgiving infrastructure that reduces crash severity), safe speeds (speed management aligned with road function and vulnerability of users), safe vehicles (crashworthiness standards and active safety technology), safe road users (licensing, education, enforcement), and effective post-crash response (rapid emergency medical care that determines survival and disability outcomes).
The UN Decade of Action for Road Safety 2021–2030 established the target of reducing road traffic deaths and injuries by 50% by 2030. Evidence shows that legislative and enforcement interventions — seatbelt laws, drink-driving limits, speed cameras — can reduce crashes by 16–26% when properly implemented and enforced. The 4th Global Ministerial Conference on Road Safety, held in Marrakech in February 2025, produced the Marrakech Declaration, endorsed by ministers from 100 countries, calling on governments to make road safety a political priority with sustained dedicated funding (WHO, 2025). A UN High-Level Meeting on Improving Global Road Safety is scheduled for July 2026 at UN Headquarters in New York.
The critical insight for prevention is that post-crash response quality determines not just survival but the severity and duration of every consequence described in this article. Faster emergency medical response, better-equipped trauma centers, integrated psychological screening, financial support referral, and family-centered rehabilitation all reduce the cascading harm. Prevention and response are not separate strategies — they are two halves of the same system.
Frequently Asked Questions
Conclusion
The 10 categories of road accident effects mapped in this article — from the immediate physical damage at the crash site through to the environmental contamination and systemic strain that receive almost no public attention — share a common characteristic: they compound. Physical injury drives disability, disability drives financial burden, financial burden drives family strain, family strain drives psychological deterioration, and the legal process running in parallel amplifies all of it. Treating these consequences as separate problems produces fragmented responses. The reality is a single cascading system of harm triggered by one event.
The global policy trajectory is moving in the right direction. The Marrakech Declaration of February 2025, endorsed by 100 countries, and the upcoming UN High-Level Meeting in July 2026 signal growing political recognition that road safety is not a transport-sector issue — it is a public health, economic development, and human rights issue. The WHO’s Safe System Approach provides the proven framework. The evidence base is clear: legislative and enforcement interventions work, post-crash response quality determines long-term outcomes, and every dollar invested in road safety returns multiples in reduced healthcare costs, preserved productivity, and human potential not lost.
The uncomfortable question this evidence raises is not whether we know how to reduce road crash consequences — we do. It is whether the political and institutional will exists to fund and sustain the systemic changes required, in every country, consistently and permanently. The 1.19 million people who die on the world’s roads each year, and the tens of millions more whose lives are diminished, are waiting for that answer.