Loading…
Safety Calculators
Rates, exposure checks, and risk scores — built for the monthly numbers safety teams actually run.
Set 01
Injury And Incident Rates
Benchmark rates, incident cost, safe days, EMR, and composite safety scores.
- LTIFR CalculatorFree LTIFR calculator — lost-time injuries per million hours (AS 1885.1 / ILO / IOGP).LTIFR = (Lost Time Injuries × 1,000,000) ÷ Total Hours WorkedOpen
- TRIFR CalculatorFree TRIFR calculator — recordable injuries per million hours (international base; OSHA TRIR dual figure).TRIFR = (Total Recordable Injuries × 1,000,000) ÷ Total Hours WorkedOpen
- DART Rate CalculatorFree OSHA DART rate calculator — days away, restricted, or transferred cases per 100 full-time workers (200,000-hour base).DART Rate = (DART Cases × 200,000) ÷ Total Hours WorkedOpen
- Incident Rate CalculatorFree OSHA incident rate calculator — total recordable cases per 100 full-time workers (TRIR / TCIR on a 200,000-hour base).Incident Rate = (Recordable Cases × 200,000) ÷ Total Hours WorkedOpen
- Severity Rate CalculatorFree severity rate calculator — lost workdays per million hours (ISO-style) or per 100 full-time workers (OSHA-style).Severity Rate = (Lost Workdays × 1,000,000 or 200,000) ÷ Total Hours WorkedOpen
- Lost Time Case Rate CalculatorFree LTCR calculator — lost-time cases per 100 full-time workers (OSHA 200,000-hour base; LTIFR twin).LTCR = (Lost Time Cases × 200,000) ÷ Total Hours WorkedOpen
- Lost Workday Rate (LWR) CalculatorFree LWR calculator — lost workdays per 100 full-time workers (OSHA 200,000-hour base; ISO severity twin).LWR = (Lost Workdays × 200,000) ÷ Total Hours WorkedOpen
- Accident Frequency Rate CalculatorFree AFR calculator — accidents per million hours worked, with OSHA-style dual figure and definition guidance.AFR = (Accidents × 1,000,000) ÷ Total Hours WorkedOpen
- Near Miss Frequency Rate CalculatorCalculate Near Miss Frequency Rate (NMFR) — near misses reported per million hours worked. Unlike injury rates, higher NMFR often signals stronger reporting culture, not worse safety.NMFR = (Near Misses × 1,000,000) ÷ Total Hours WorkedOpen
- Fatality Rate CalculatorCalculate workplace Fatality Rate — work-related deaths per million hours worked. The most severe lagging safety indicator; zero is the only acceptable target.Fatality Rate = (Fatalities × 1,000,000) ÷ Total Hours WorkedOpen
- Hours Worked CalculatorEstimate total hours worked from headcount and schedule — feeds LTIFR, TRIFR, DART, and other rate calculators (OSHA 2,000-hour year option).Hours = Headcount × Hours/Period × PeriodsOpen
- Incident Cost CalculatorEstimate total incident cost from direct costs and an indirect multiplier, plus simple safety project ROI from savings versus programme cost.Total = Direct × (1 + Indirect ratio) · ROI % = (Savings − Cost) ÷ Cost × 100Open
- Safe Days CalculatorDays and hours since the last lost-time injury (or chosen incident), plus progress toward a safe-days milestone target.Safe days = Calendar days since last incident · Progress % = Safe days ÷ Target × 100Open
- EMR CalculatorEstimate Experience Modification Rate as actual primary losses versus expected losses — insurance pricing indicator for contractors.EMR ≈ Actual primary losses ÷ Expected lossesOpen
- Composite Safety Score CalculatorBuild a weighted 0–100 composite from LTIFR, TRIFR, near-miss, and audit (or custom) scores for leadership dashboards.Score = Σ (weight_i × metric_i) ÷ Σ weightsOpen




Set 02
Work At Height
Fall clearance, ladder set-back, scaffold bay load, and horizontal lifeline sag.
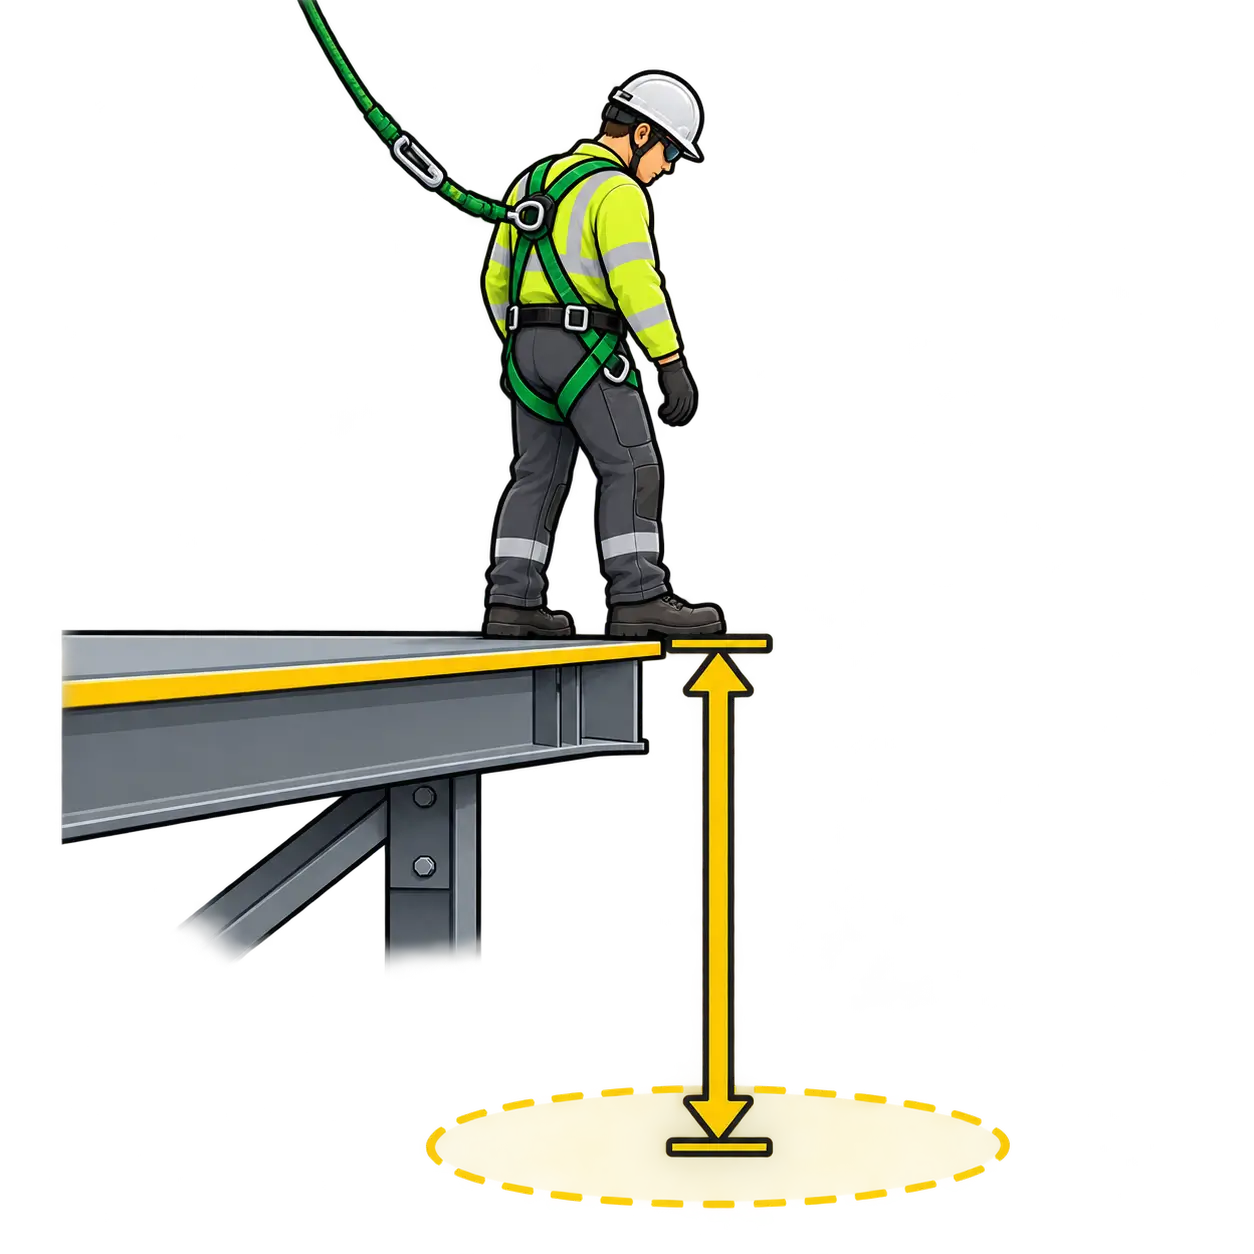
- Fall Clearance CalculatorMinimum fall clearance for a personal fall arrest system — free fall, deceleration, harness stretch, and safety factor (OSHA-style planning aid).Required Clearance = Free Fall + Deceleration + Harness Stretch + Safety Factor (+ Sag)Open
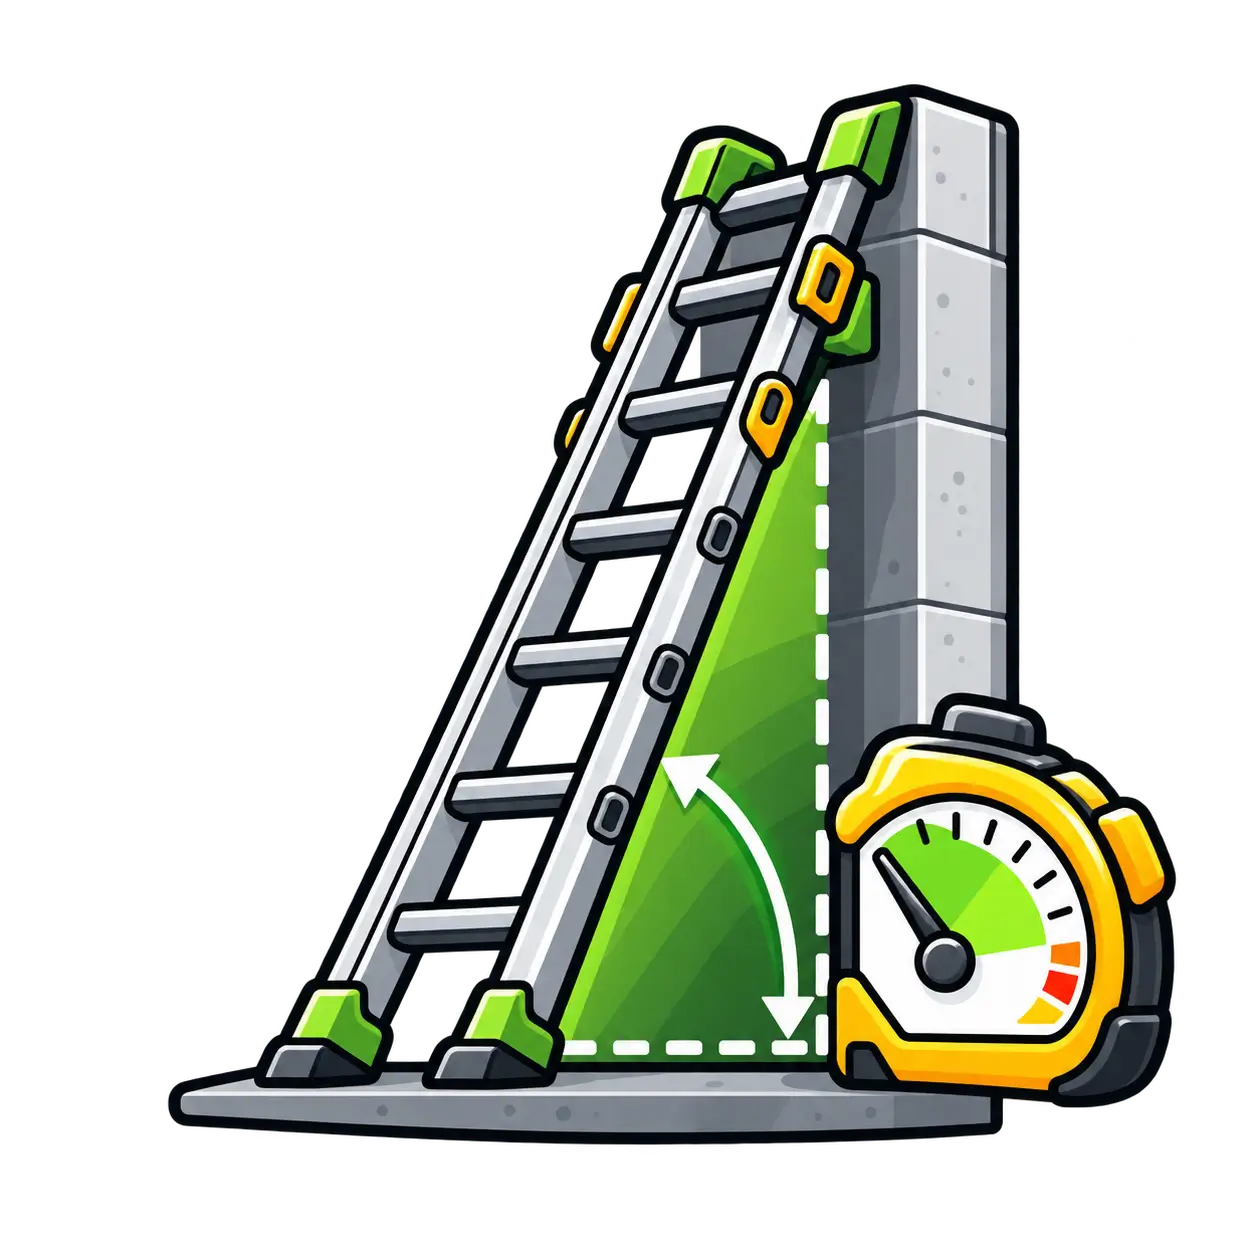
- Ladder Angle CalculatorOSHA 4-to-1 ladder set-up — base distance from the wall, minimum ladder length, and angle from height to the top support.Base = Height ÷ 4 · Length = √(H² + Base²) (+ extension above landing)Open
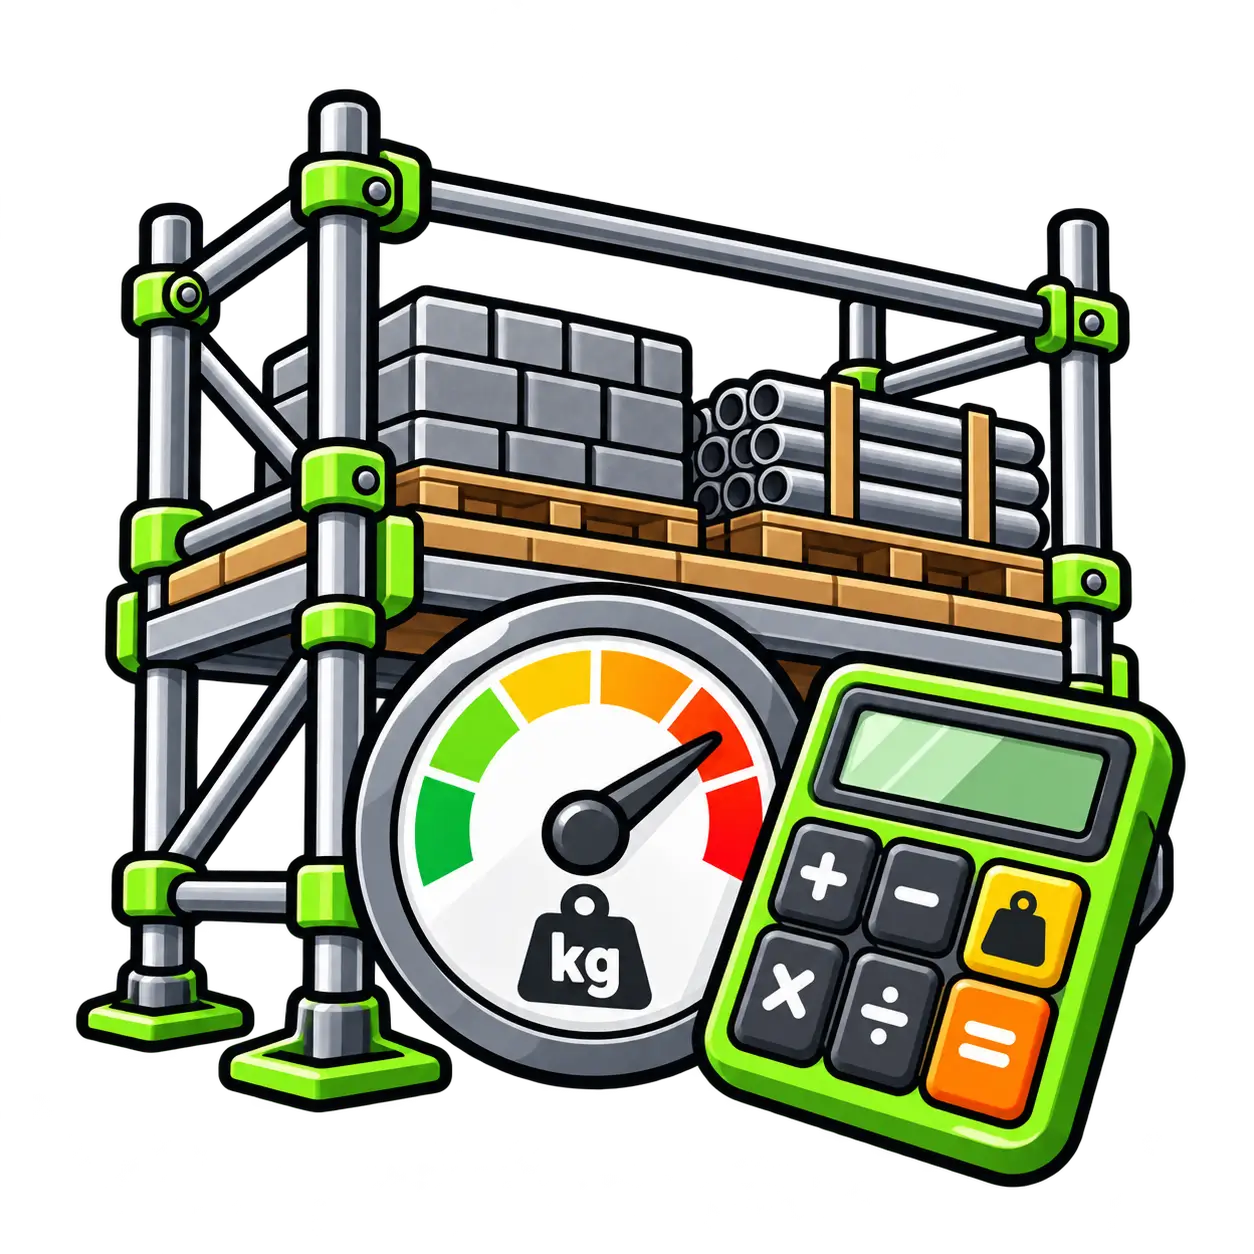
- Scaffold Bay Load CalculatorEstimate allowable distributed load on a scaffold bay from duty class (kN/m²) and bay plan area — TG20-style planning aid.Allowable load (kN) = Duty (kN/m²) × Bay area (m²)Open
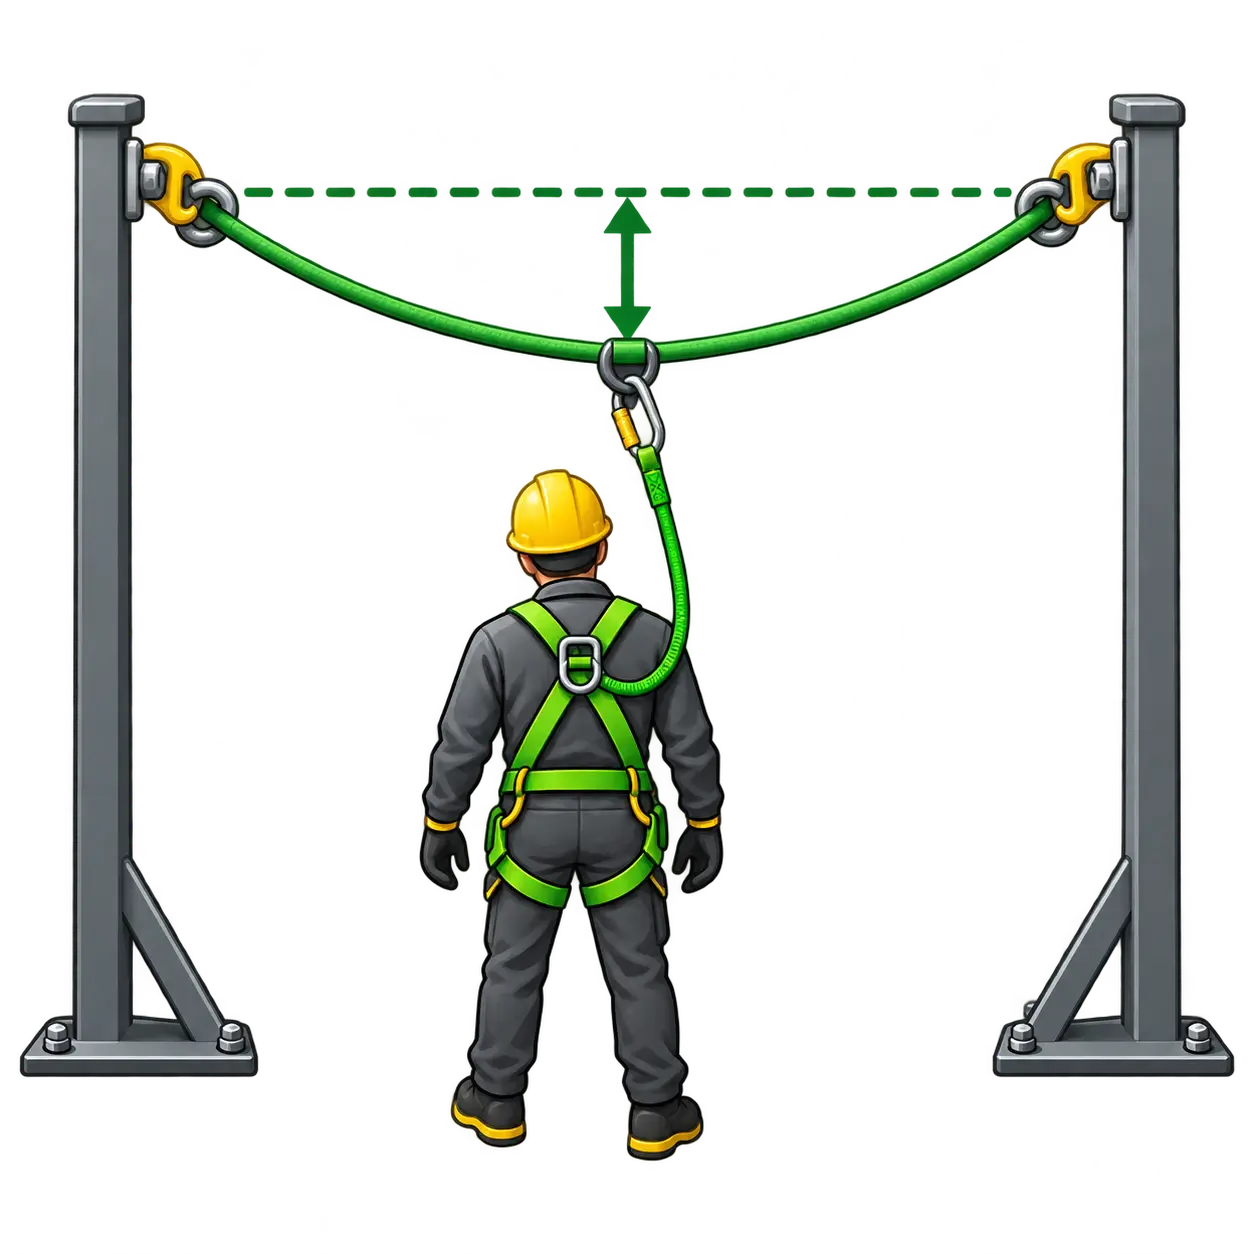
- Horizontal Lifeline Sag CalculatorEstimate midspan sag of a horizontal lifeline under load and add it into fall clearance planning — simplified cable model.Sag ≈ (w × L²) ÷ (8 × T) · Clearance ≈ Free fall + Decel + Sag + SafetyOpen
Set 03
Lifting And Rigging
Sling angle, MAC screening, and crane capacity vs working radius.
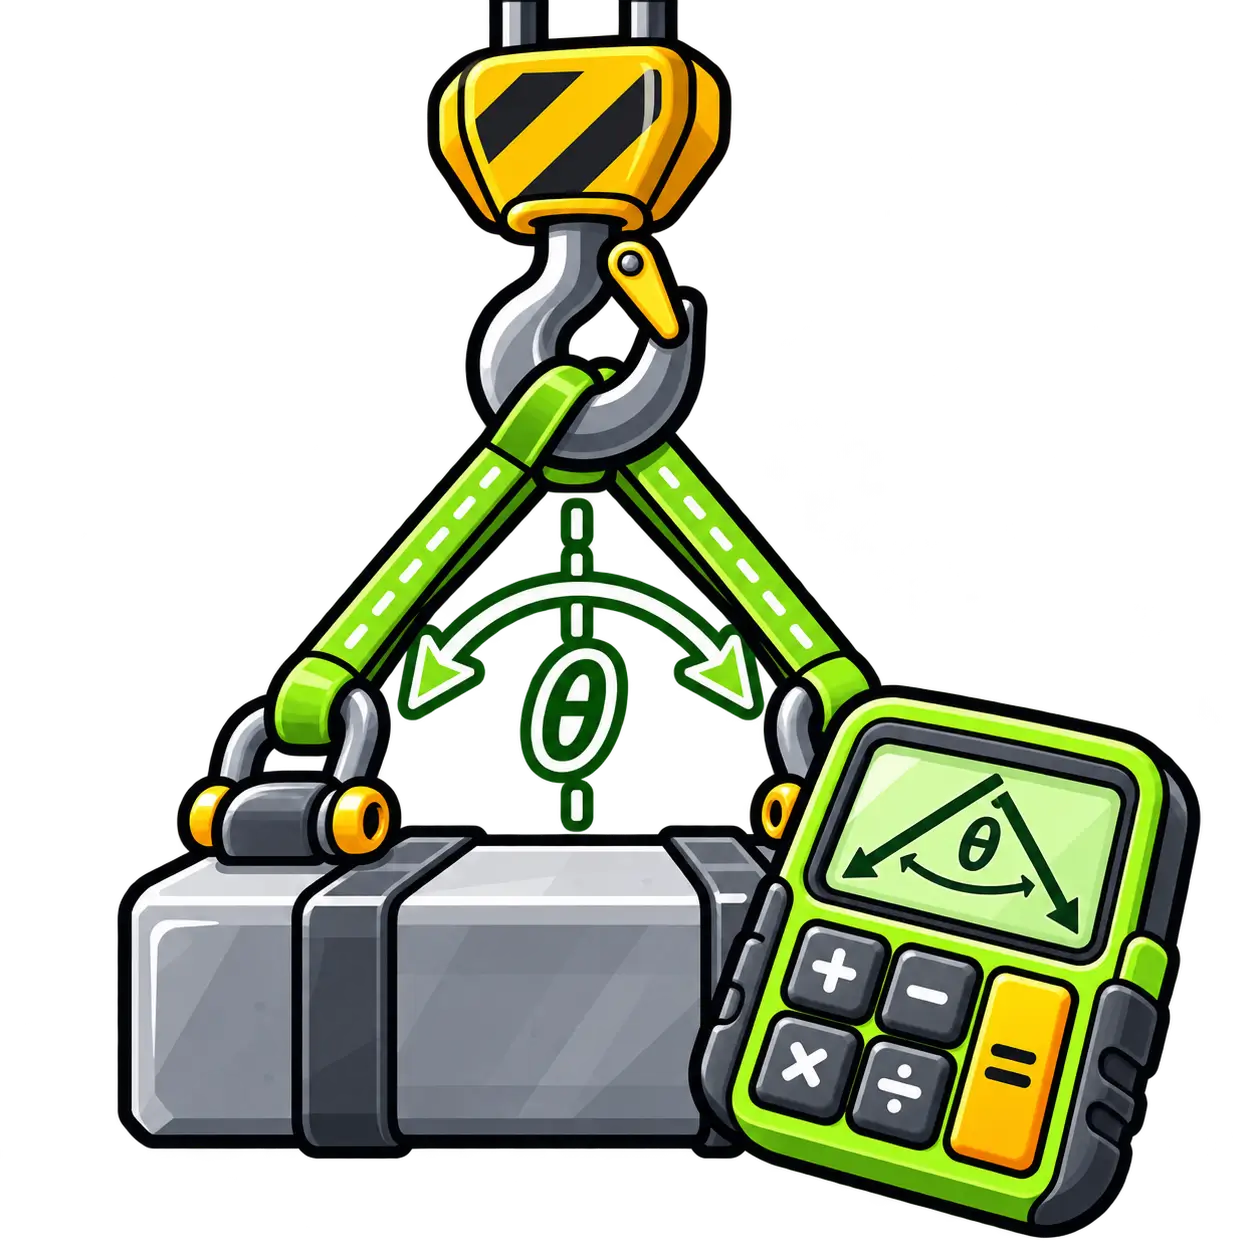
- Sling Angle CalculatorTension in each sling leg from load, number of legs, and angle from horizontal — shows how flat angles multiply force on the gear.Tension per leg = (Load ÷ Legs) ÷ sin(θ)Open
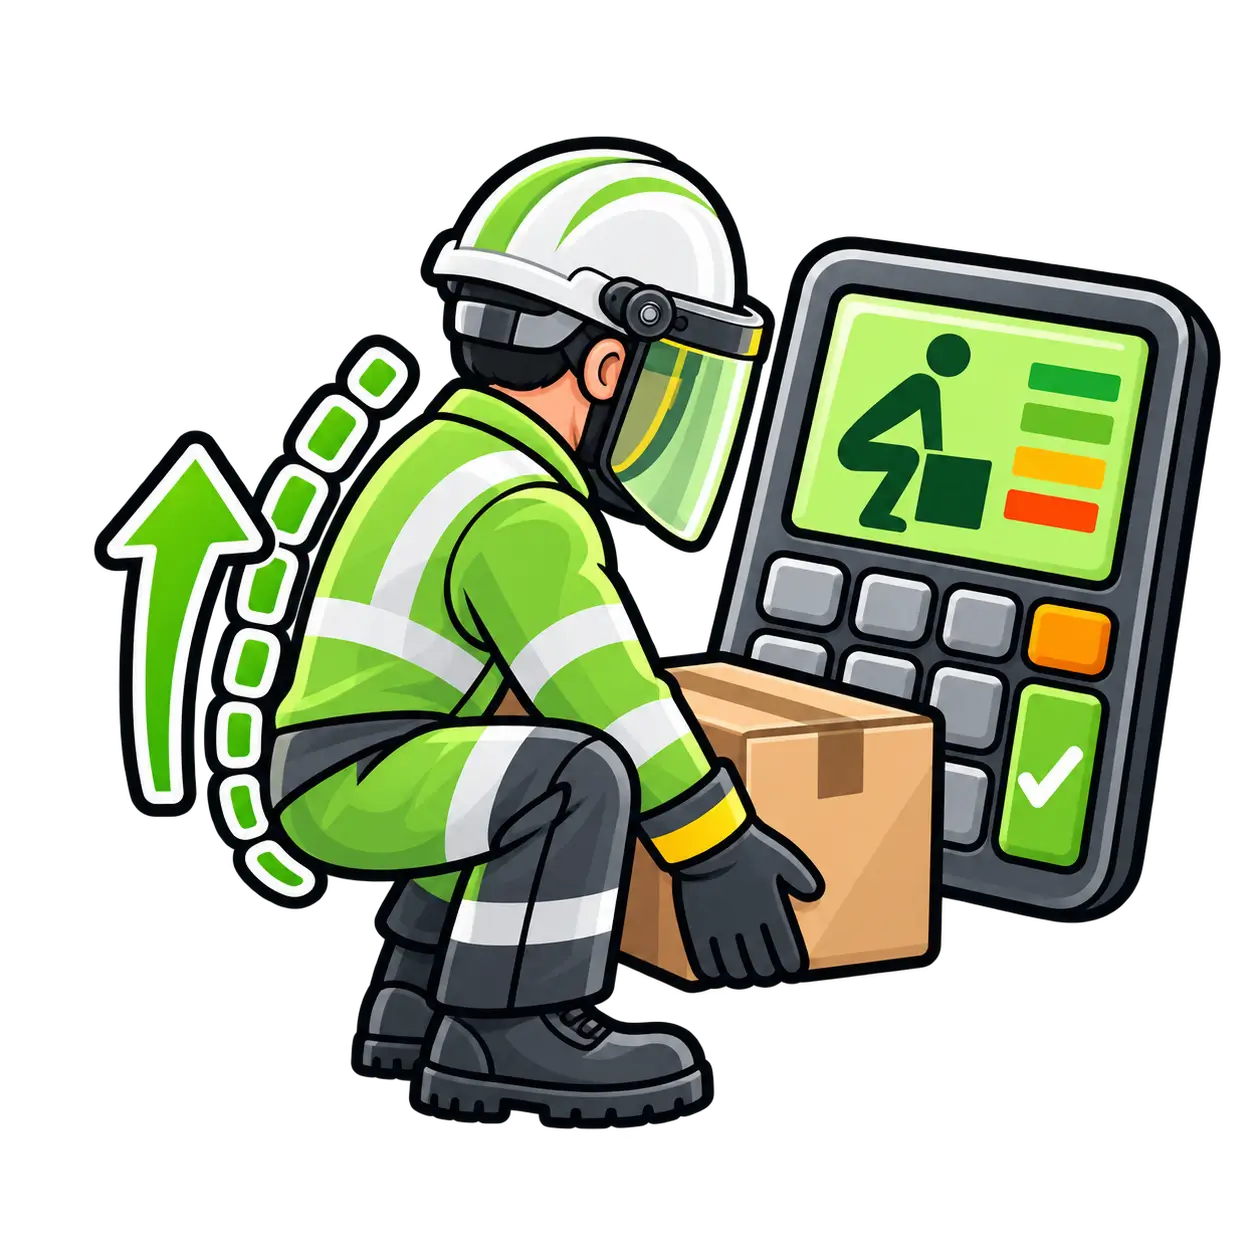
- MAC Manual Handling CalculatorSimplified HSE Manual Handling Assessment Charts (MAC) style score for load weight, frequency, posture and carry distance — colour-band screening.MAC colour from load + frequency + posture + distance scoresOpen
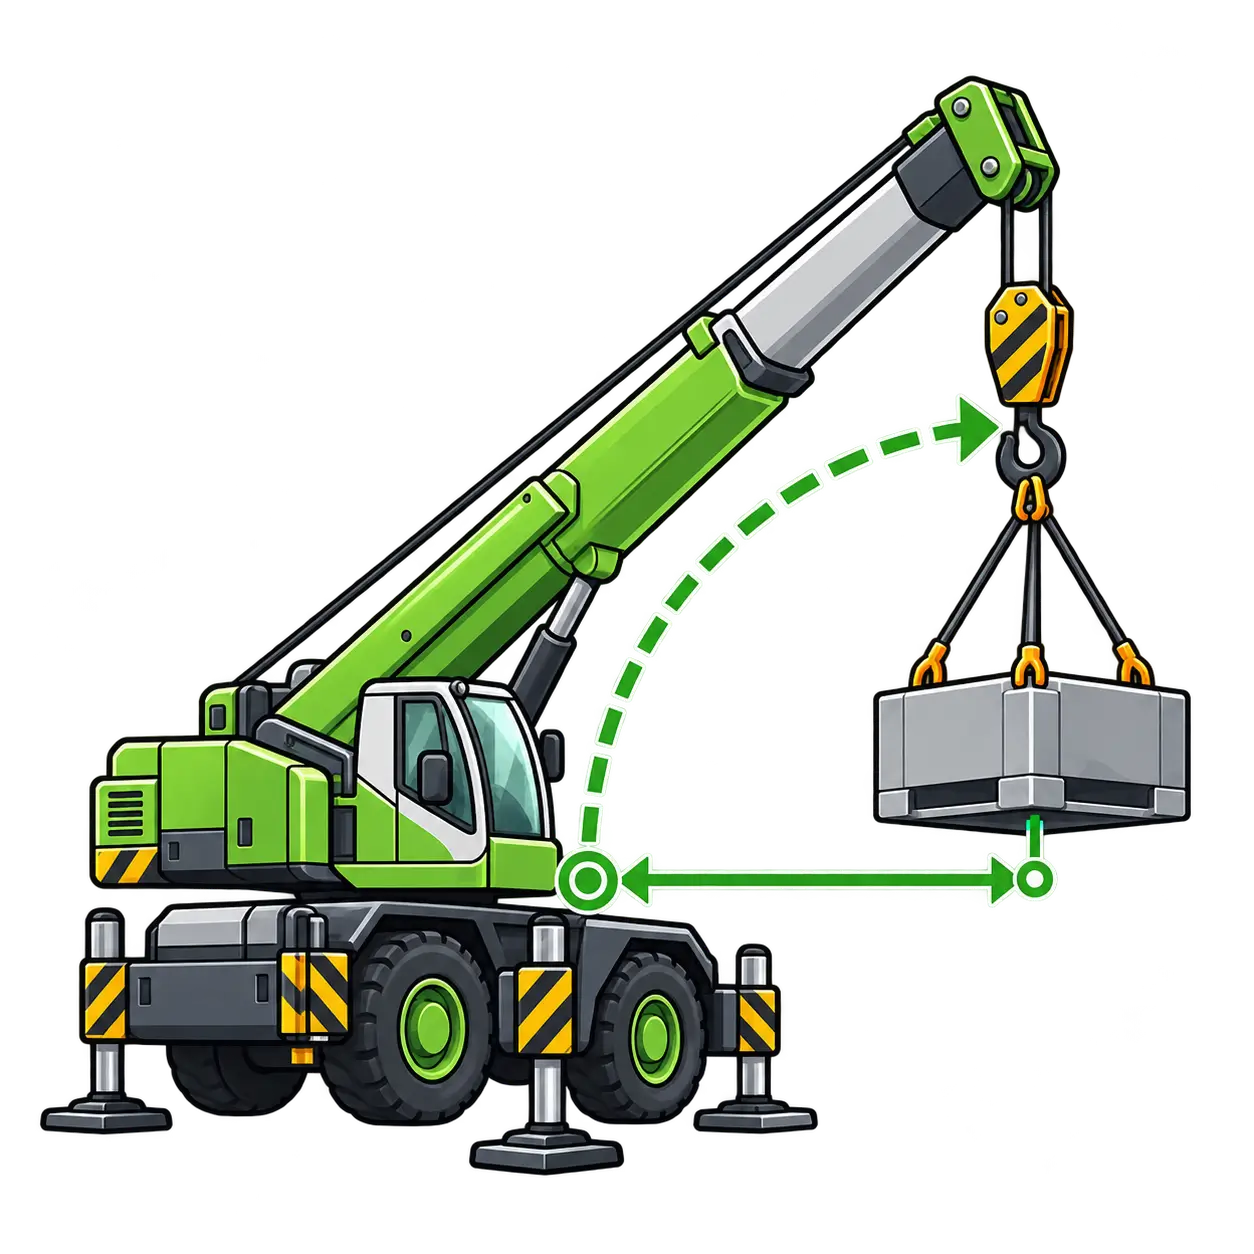
- Crane Load vs Radius CalculatorInterpolate approximate crane capacity between two load-chart points at a working radius — lift planning aid, not a substitute for the chart.Capacity ≈ linear interpolate between chart radiiOpen
Set 04
Fleet And Warehouse
Forklift load-center capacity and vehicle stopping distance for site traffic.
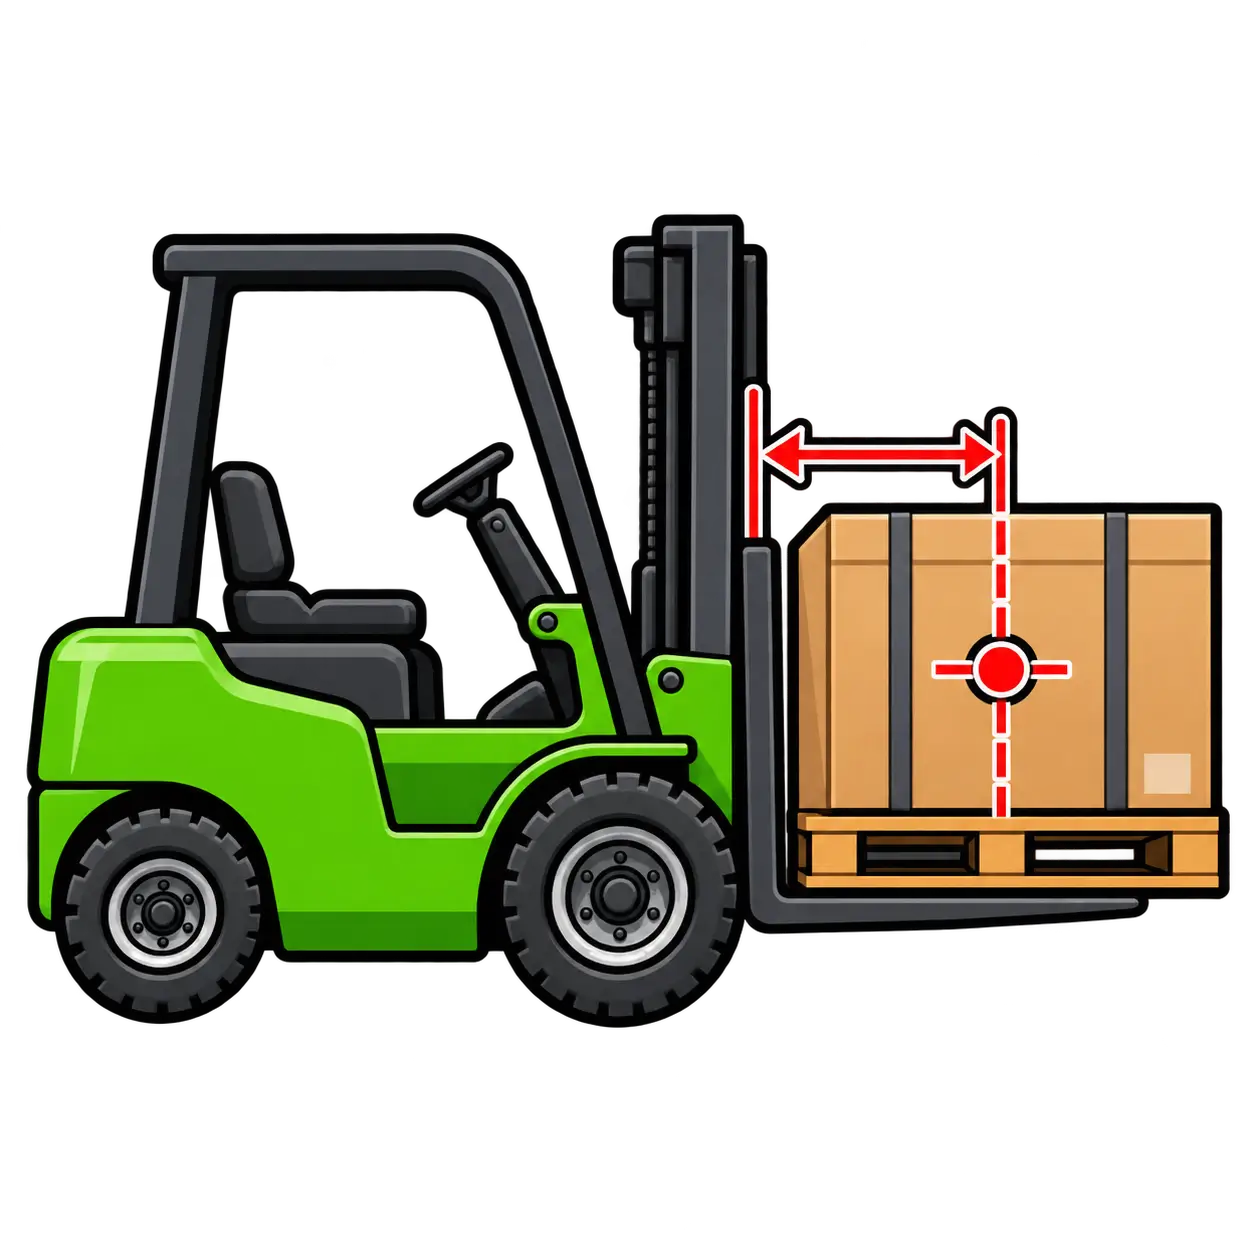
- Forklift Load Center CalculatorEstimate remaining rated capacity when load center exceeds the truck nameplate center — warehouse lifting planning aid.Allowable ≈ Rated × (Rated LC ÷ Actual LC)Open
- Vehicle Stopping Distance CalculatorEstimate thinking + braking distance from speed, reaction time, and deceleration — fleet and site traffic planning aid.s = v·t + v² ÷ (2·a)Open

Set 05
Exposure And Environment
Heat work/rest, noise addition, LEV capture, spill berms, silica, lighting, and ergonomics.
- Heat Stress Index (WBGT) CalculatorCalculate WBGT (Wet Bulb Globe Temperature) from wet bulb, globe, and dry bulb readings — indoor and outdoor formulas with indicative heat-stress guidance.Outdoor: 0.7·Tnwb + 0.2·Tg + 0.1·Tdb · Indoor: 0.7·Tnwb + 0.3·TgOpen
- Heat Index CalculatorNWS-style heat index from air temperature and relative humidity — with caution / danger bands for outdoor work planning (companion to WBGT).HI = Rothfusz regression f(T°F, RH%)Open
- Cold Stress / Wind Chill CalculatorNWS wind chill from air temperature and wind speed — with frostbite-risk guidance for outdoor cold work (companion to heat index / WBGT).WC = 35.74 + 0.6215·T − 35.75·V^0.16 + 0.4275·T·V^0.16 (°F, mph)Open
- WBGT Work / Rest CalculatorSuggest work/rest allocation from WBGT and workload category using ACGIH-style screening table bands — heat-stress planning aid.Work/rest % from WBGT × workload screening tableOpen
- Noise Exposure CalculatorCalculate daily noise dose across multiple exposures using a NIOSH-style 3 dB exchange rate and 85 dB(A) criterion — plus equivalent 8-hour TWA.Dose % = 100 × Σ (C ÷ T), where T = 8 × 2^((85 − L) ÷ 3) hoursOpen
- Hearing Protection CalculatorEstimated protected noise level from NRR or SNR with OSHA, NIOSH, or SNR derating — so you can check if plugs or muffs are enough.OSHA: L − (NRR − 7) ÷ 2 · NIOSH: L − (NRR × derate) · SNR: L − (SNR − 4)Open
- Noise Level Addition CalculatorCombine two or more sound pressure levels in decibels using logarithmic addition — for multi-source workplace noise estimates.L_total = 10 × log₁₀(Σ 10^(Li/10))Open
- Sound Distance CalculatorEstimate how sound pressure level changes with distance using the inverse-square (point source) rule — planning aid outdoors or in free field.L₂ = L₁ − 20 × log₁₀(r₂ ÷ r₁)Open
- Hand-Arm Vibration (HAV) CalculatorDaily hand-arm vibration exposure A(8) and HSE exposure points from tool vibration values and trigger times — against EU/UK EAV and ELV.A(8) = √(Σ a² × t ÷ 8) · Points ≈ 2 × a² × hoursOpen
- Whole-Body Vibration (WBV) CalculatorDaily whole-body vibration A(8) from vibration magnitude and exposure time — against EU/UK EAV 0.5 and ELV 1.15 m/s².A(8) = a × √(t ÷ 8) · multi-source: √(Σ a² × t ÷ 8)Open
- Respirator APF / MUC CalculatorRequired assigned protection factor from concentration ÷ OEL, maximum use concentration (APF × OEL), and whether a chosen respirator class is enough.Required APF = C ÷ OEL · MUC = APF × OELOpen
- Chemical Mixture TLV CalculatorAdditive mixture exposure Em = Σ (Ci ÷ Li) for similarly acting substances — flag when Em exceeds 1 (ACGIH / OSHA-style).Em = C₁/L₁ + C₂/L₂ + … + Cn/LnOpen
- PPM to mg/m³ CalculatorConvert gas or vapour concentration between ppm and mg/m³ using molecular weight and a chosen molar volume (25 °C / 20 °C).mg/m³ = (ppm × MW) ÷ Vm · ppm = (mg/m³ × Vm) ÷ MWOpen
- Silica / RCS Exposure CalculatorEstimate respirable crystalline silica 8-hour TWA from task concentrations and durations, then compare to a chosen WEL/PEL.TWA = Σ (Ci × ti) ÷ 8 · Ratio = TWA ÷ LimitOpen
- LEV Capture Velocity CalculatorEstimate capture velocity at a distance from an LEV hood opening from volumetric flow and hood face area — industrial ventilation planning aid.V_face = Q ÷ A · V_capture ≈ Q ÷ (10 × X² + A) (plain opening approx.)Open
- Air Changes per Hour CalculatorCalculate Air Changes per Hour (ACH) from supply/exhaust airflow and room volume — imperial or metric — with indicative guidance for offices, classrooms, labs, and healthcare spaces.ACH = (CFM × 60) ÷ (Length × Width × Height)Open
- Lux / Illuminance CalculatorLumen method — number of luminaires for a target lux level, or average illuminance from installed lamps (UF × MF).N = (E × A) ÷ (Φ × UF × MF) · E = (N × Φ × UF × MF) ÷ AOpen
- Radiation Dose CalculatorCalculate absorbed, equivalent, and tissue contribution to effective radiation dose using simplified ICRP-style weighting factors — with mSv conversion and ALARA limit context.Absorbed = Energy ÷ Mass · Equivalent = Absorbed × WR · Effective = Equivalent × WTOpen
- Spill Containment Berm CalculatorEstimate secondary containment volume for a tank or pallet of drums and check against a berm footprint × height.Need ≥ tank volume × factor · Berm V = L × W × HOpen
- Ergonomic Risk CalculatorAssess manual lifting risk with the NIOSH Revised Lifting Equation — Recommended Weight Limit (RWL) and Lifting Index (LI) from reach, height, travel, twist, frequency, and coupling.RWL = 23 × HM × VM × DM × AM × FM × CM · LI = Load ÷ RWLOpen
- REBA Ergonomic CalculatorRapid Entire Body Assessment score from neck, trunk, legs, arms, wrists, load, coupling, and activity — indicative MSD risk bands.REBA score from posture tables A + B + C (1–15)Open
- RULA Ergonomic CalculatorRapid Upper Limb Assessment score from upper arms, lower arms, wrists, neck, trunk, and muscle/force — indicative MSD action levels 1–7.RULA score from Tables A + B + C (1–7)Open



Set 06
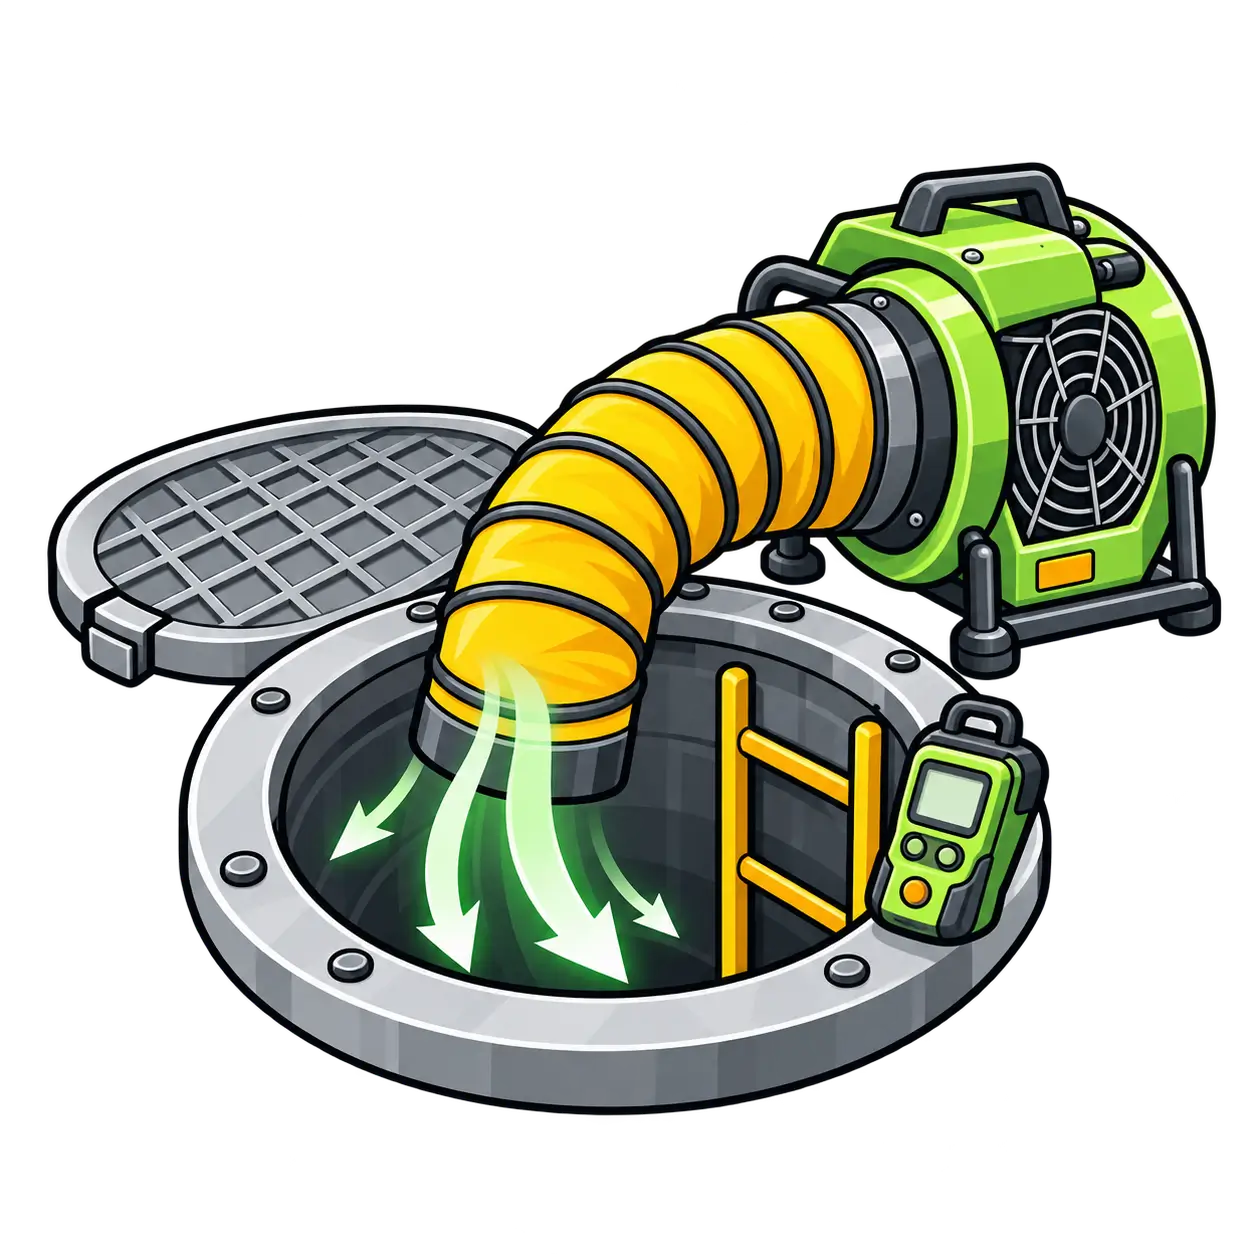
Confined Space
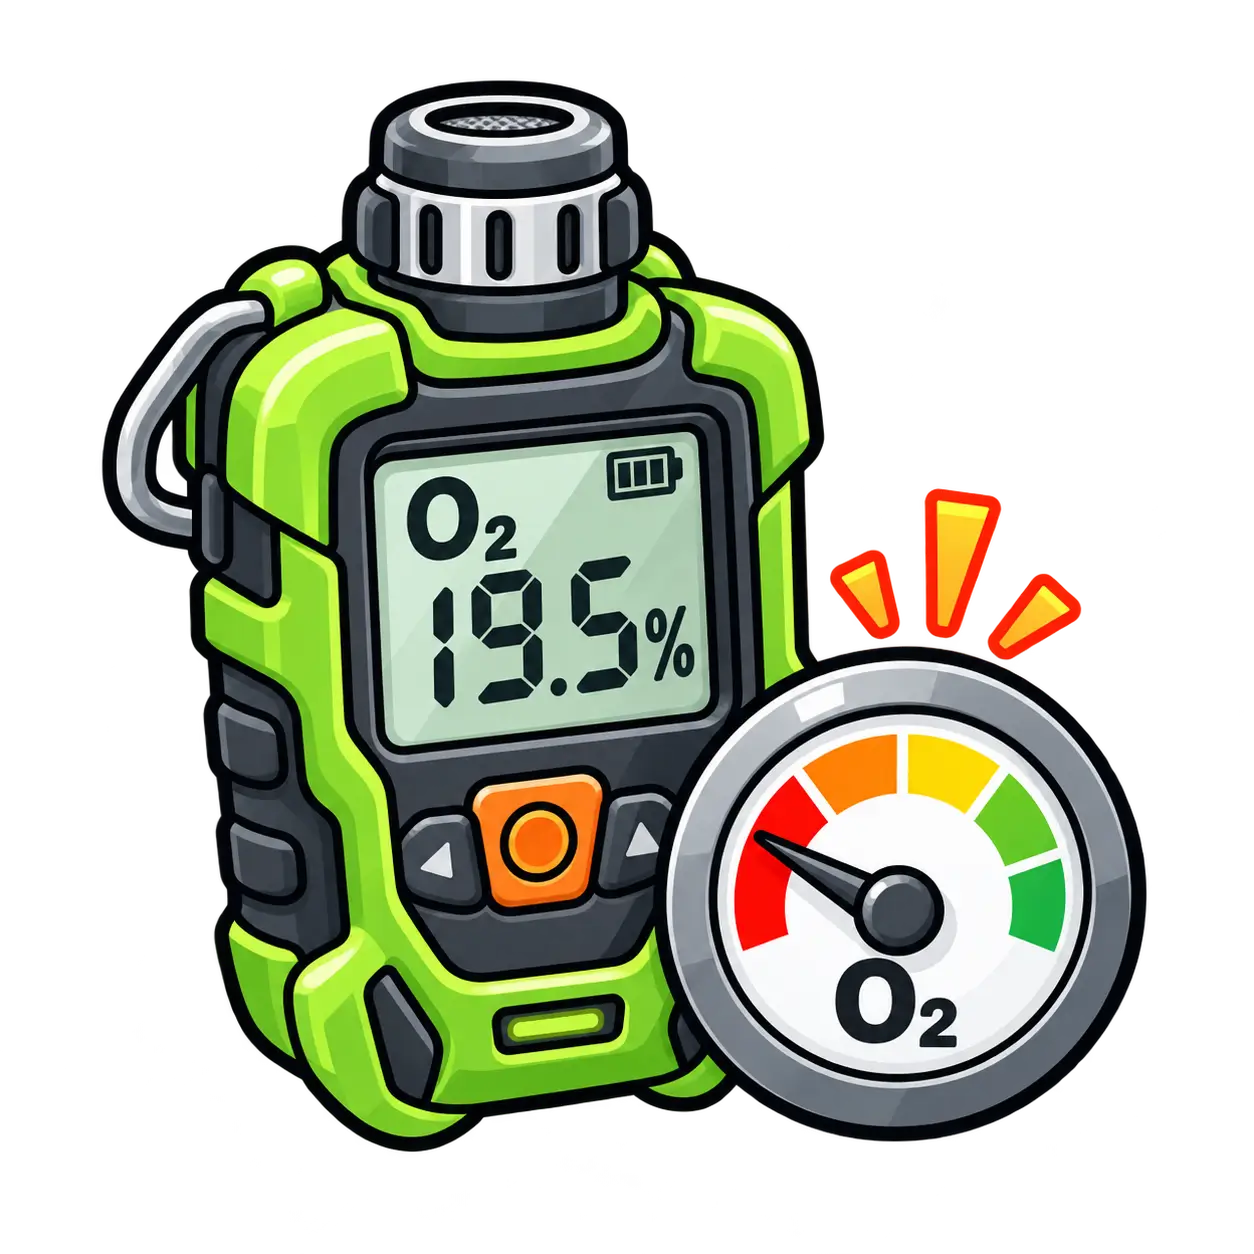
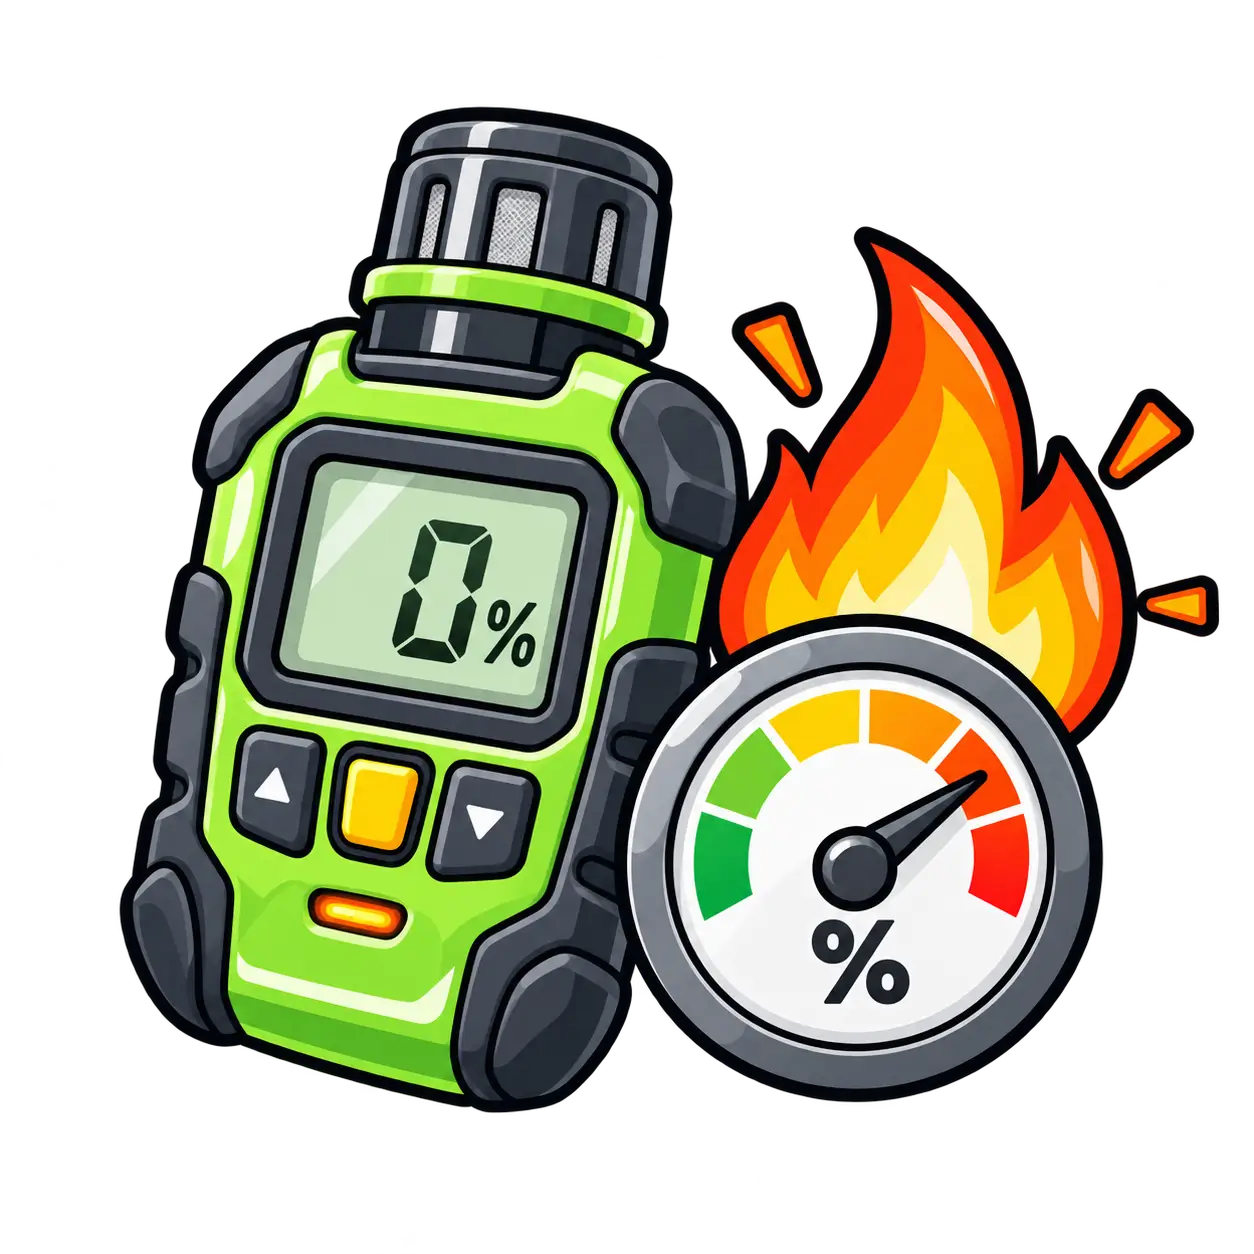
Purge time, residual oxygen, and %LEL for gas testing — planning aids, not a permit alone.
- Confined Space Purge CalculatorEstimate dilution purge / ventilation time to drop a contaminant from initial to target concentration — perfect-mixing model for planning only.t = (V ÷ Q) × ln(C₀ ÷ C) · Air changes = ln(C₀ ÷ C)Open
- Oxygen Deficiency CalculatorEstimate residual oxygen after inert gas displacement or dilution in a confined space — flag deficiency (<19.5%) or enrichment (>23.5%).O₂% ≈ 20.9 × e^(−V_inert ÷ V) or O₂% = 20.9 × (1 − V_displaced ÷ V)Open
- LEL / Flammable Mixture CalculatorConvert measured flammable gas concentration to % of Lower Explosive Limit (LEL) for gas testing and hot-work decisions.%LEL = (Measured %vol ÷ LEL %vol) × 100Open
Set 07
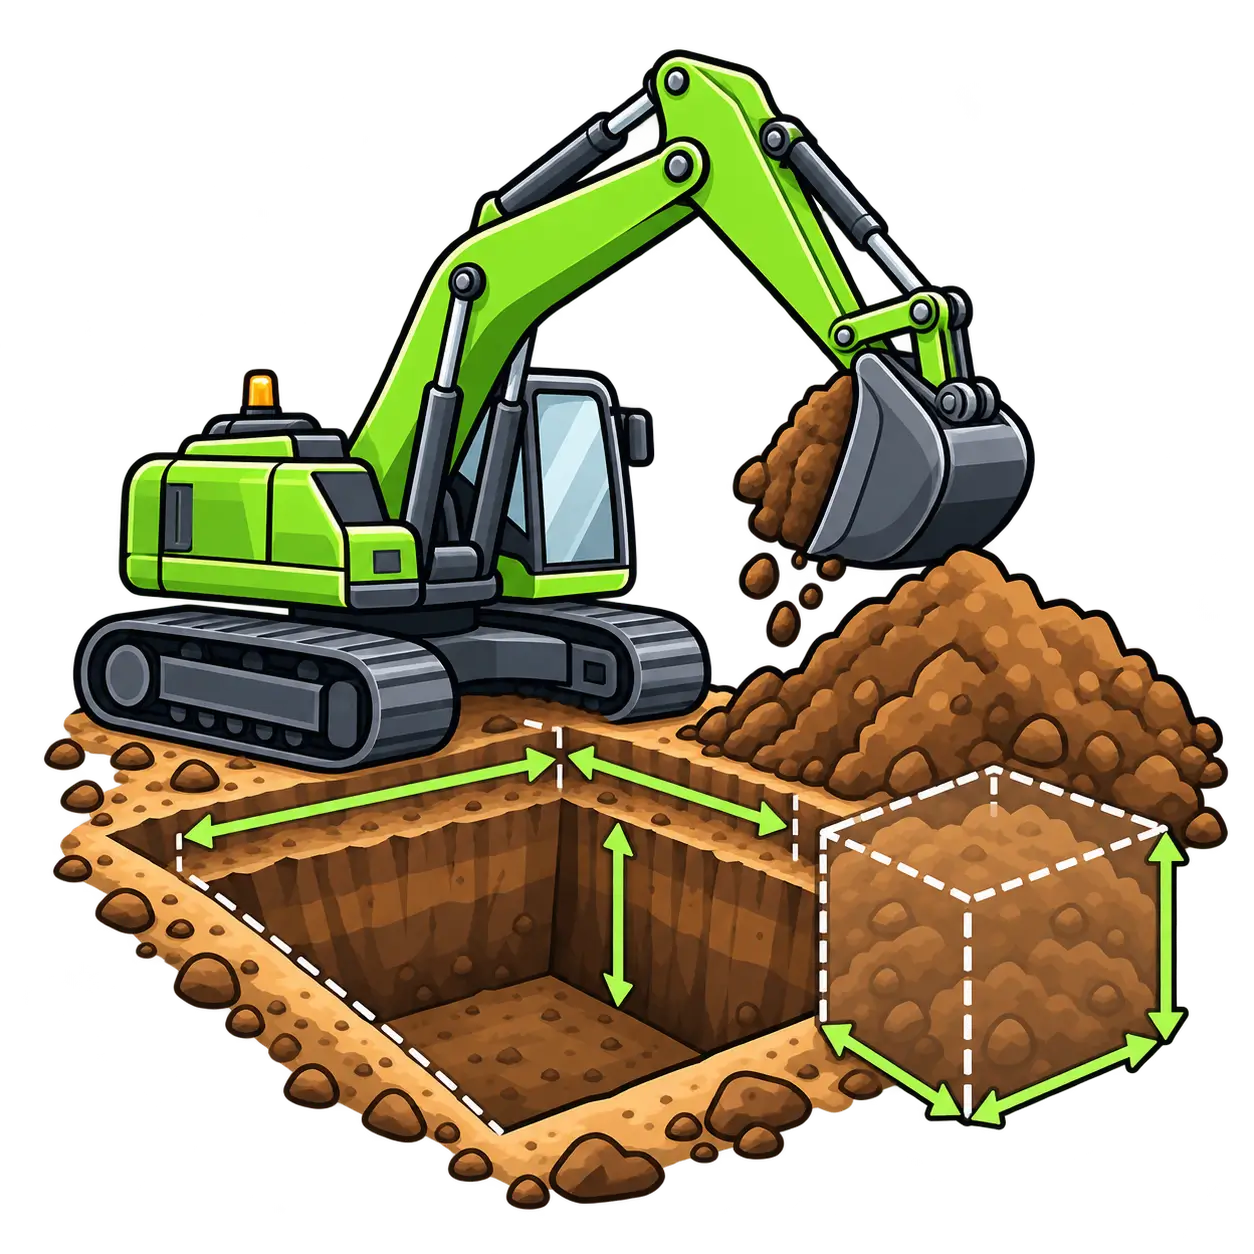
Construction
Estimate trench or pit cut volume and loose spoil with a swell factor.
Set 08
Fire And Emergency
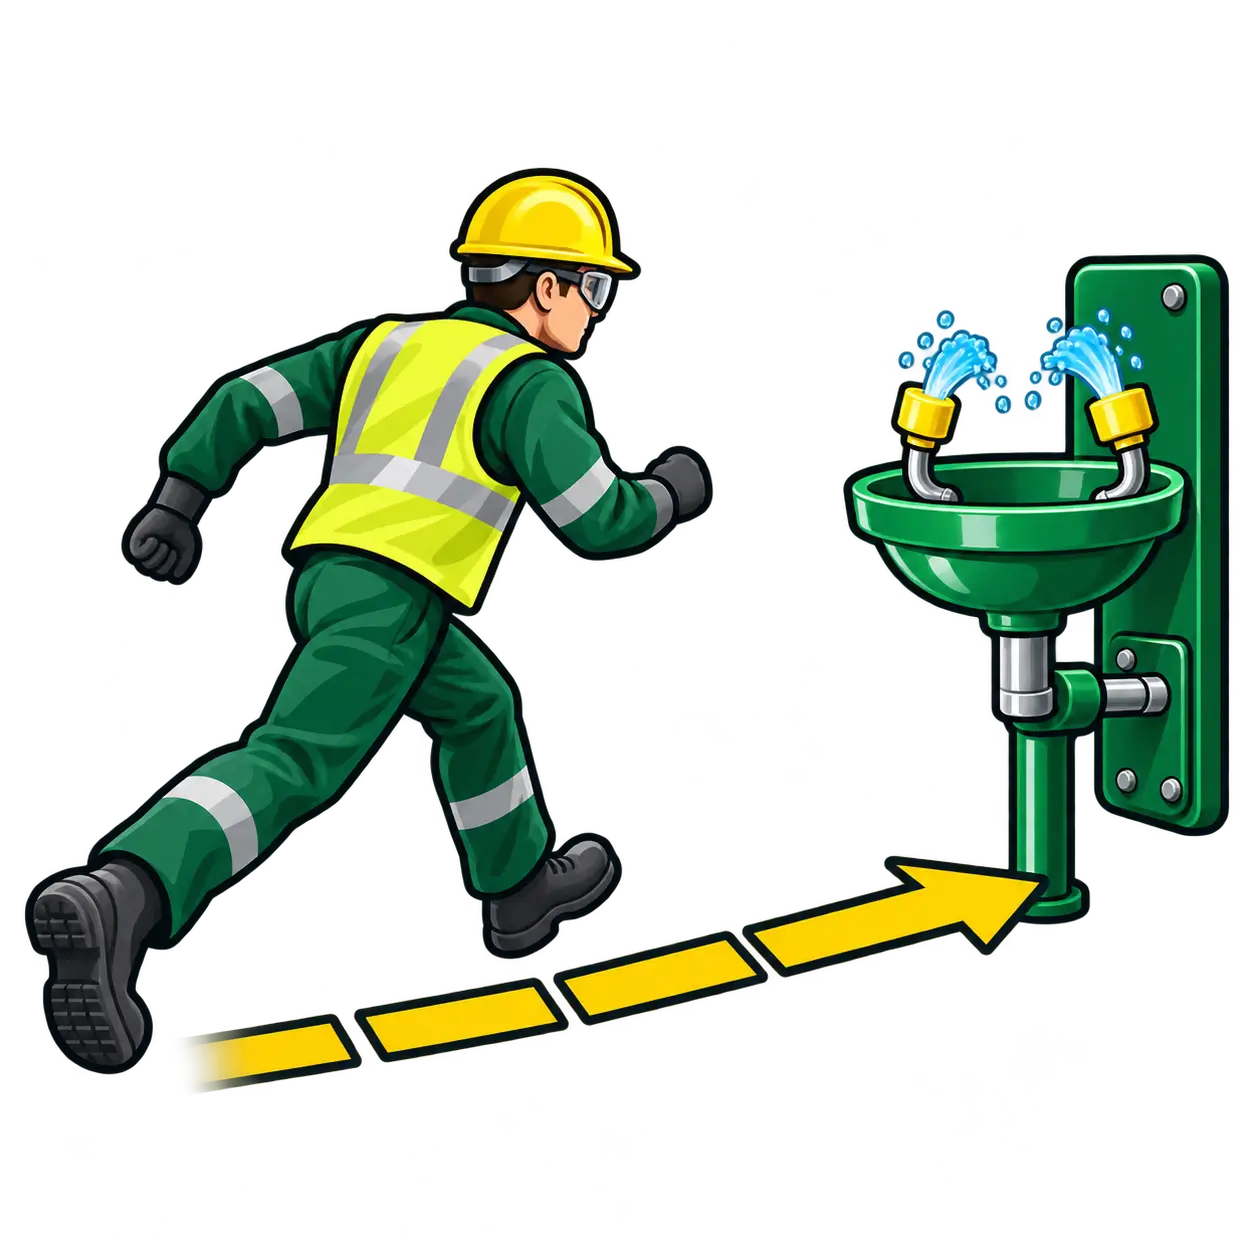
Extinguishers, SCBA, fire load, evacuation, first aid needs, and eyewash travel time.
- Fire Extinguisher CalculatorMinimum Class A extinguisher count from floor area, hazard occupancy, and A-rating — with NFPA 10-style travel-distance reminders.Units needed = Area ÷ (A-rating × ft² per A-unit)Open
- SCBA Duration CalculatorEstimate breathing-air duration from cylinder free-air volume and consumption rate, with optional pressure/reserve inputs for BA sets.Duration (min) = Usable free air (L) ÷ Consumption (L/min)Open
- Fire Load Density CalculatorEstimate fire load density (MJ/m²) from combustible mass and calorific value over floor area — planning aid for fire strategy discussions.q = (m × H) ÷ A (MJ/m²)Open
- Evacuation Time CalculatorEstimate building evacuation time from travel distance, walking speed, occupant load, and exit capacity — simplified egress planning aid.t ≈ t_travel + t_queue · t_travel = Distance ÷ Speed · t_queue = Occupants ÷ (Width × Flow)Open
- First Aid Needs CalculatorEstimate first aiders and appointed persons from headcount and workplace hazard level — HSE-style planning table for sites and offices.First aiders from headcount × hazard band (HSE-style table)Open
- Eyewash Travel Distance CalculatorCheck walking time and distance to an emergency eyewash/shower against the common 10-second / 55-foot planning rule.Time = Distance ÷ Walking speed · Compare to 10 s / 55 ft guidanceOpen

Set 09
Electrical
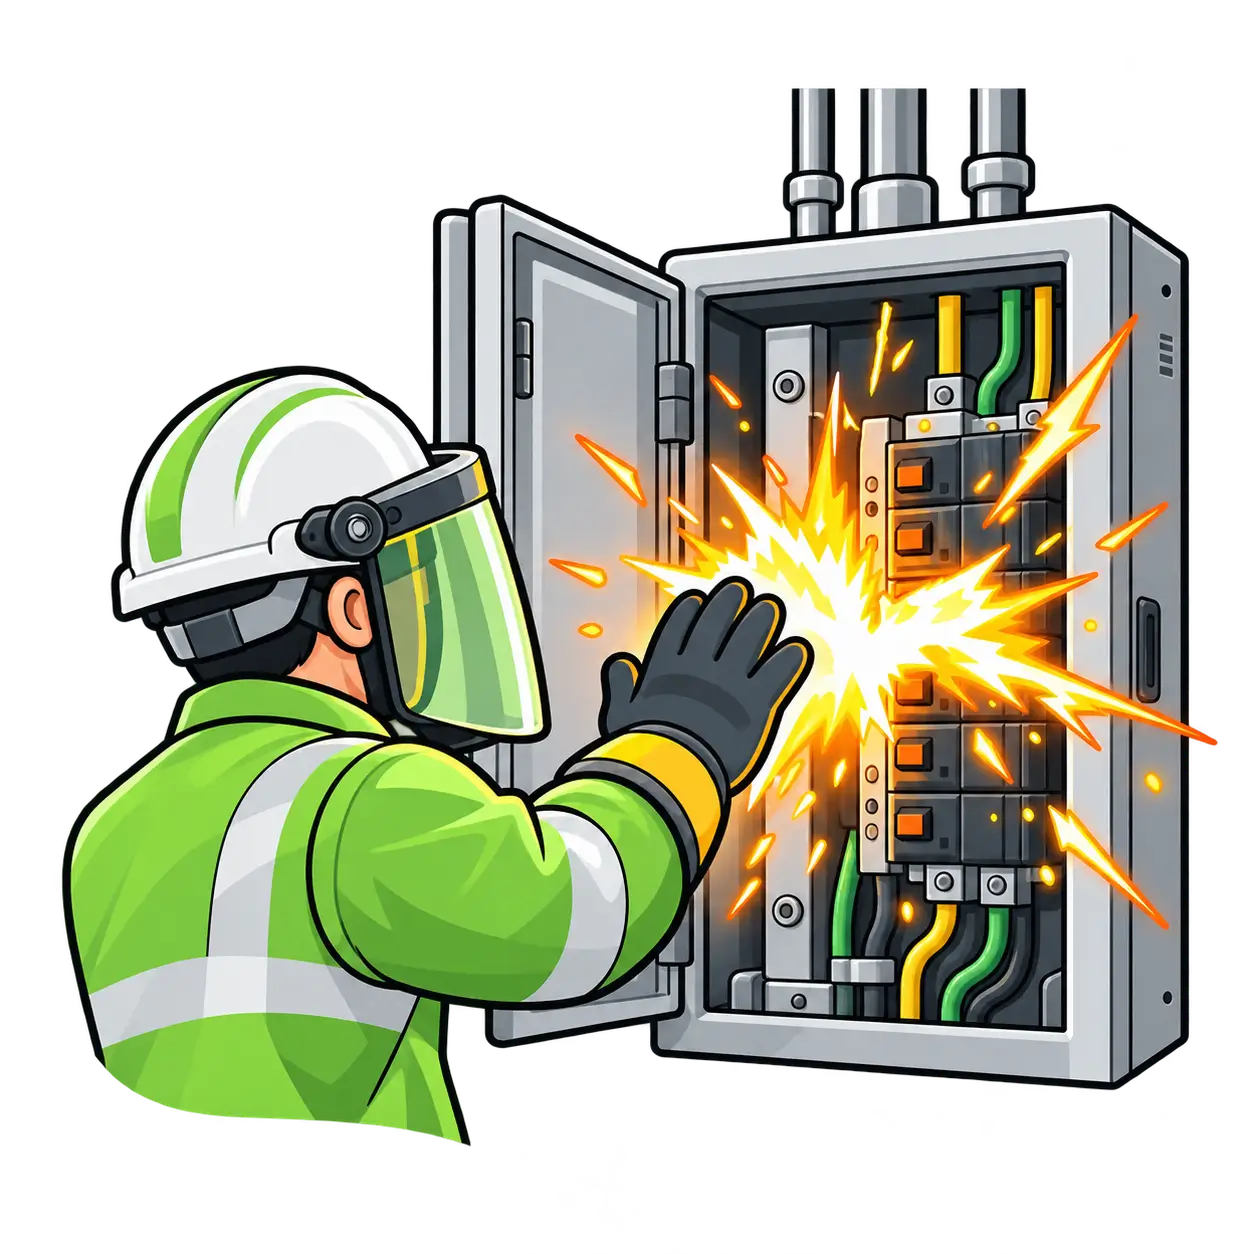
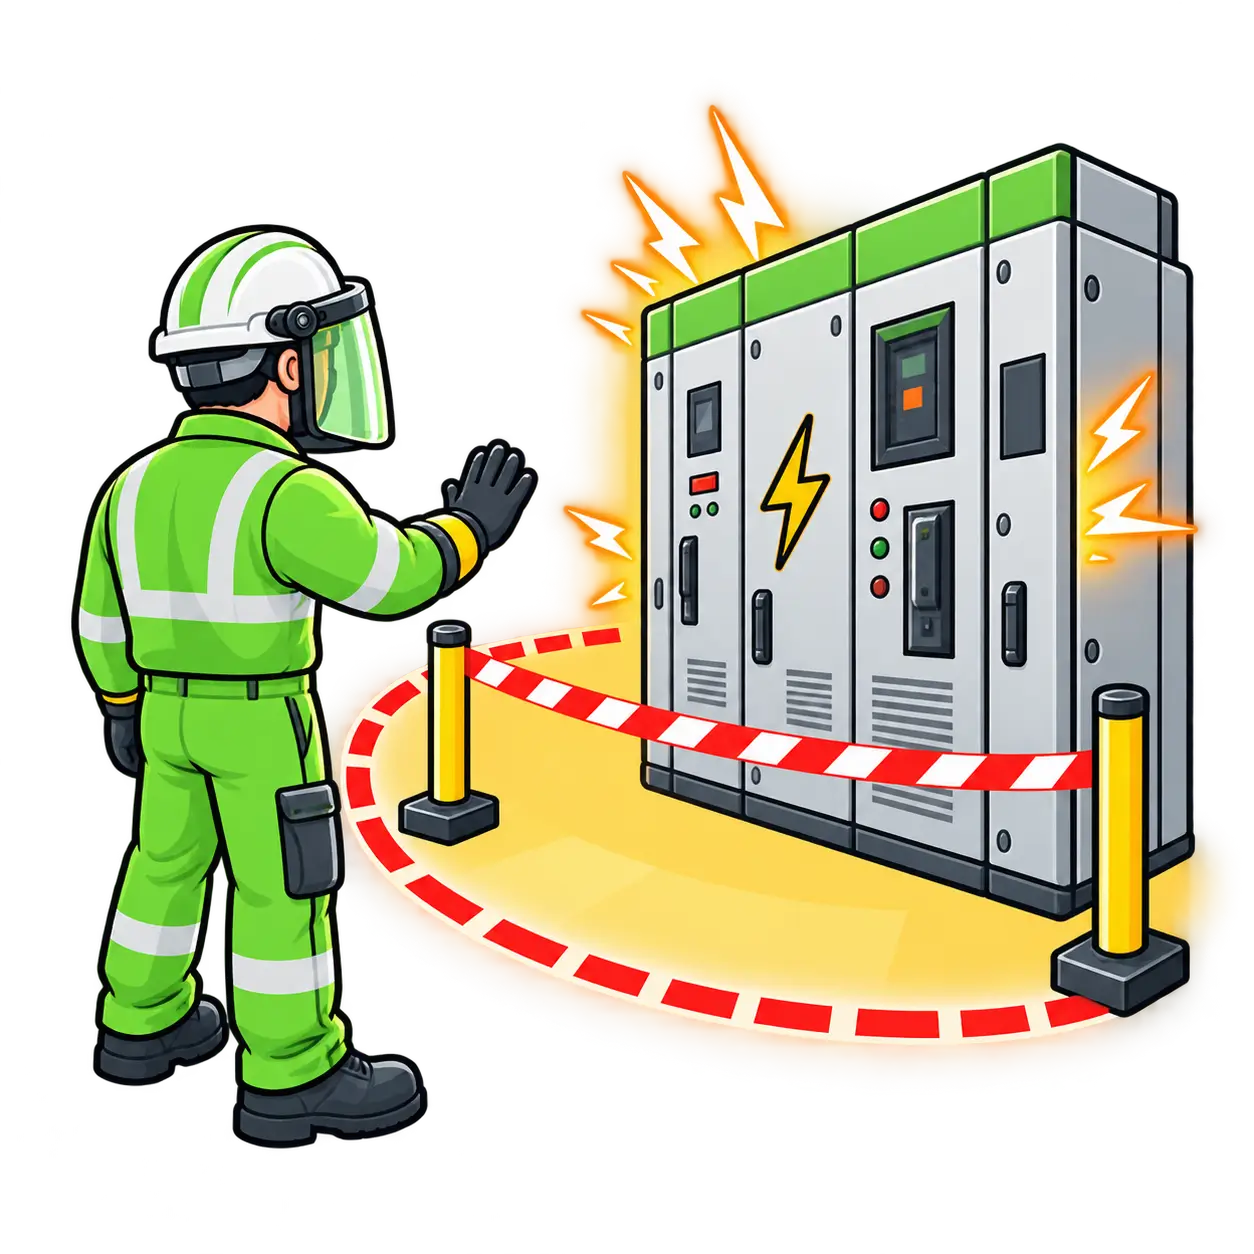
Map incident energy to PPE category and look up approach boundaries — planning aids, not substitutes for a qualified study.
- Arc Flash CalculatorMap incident energy (cal/cm²) to NFPA 70E-style PPE category, or estimate rough open-air energy from fault current, clearing time, and working distance — planning aid only.PPE from IE bands · Rough IE ≈ (793 × F × V × t) ÷ D² (Lee-style open air)Open
- Electrical Approach Boundary CalculatorLook up indicative limited and restricted approach boundaries by system voltage for AC or DC — planning aid aligned with NFPA 70E-style tables.Boundary distances from voltage range tables (limited / restricted approach)Open
Set 10
Risk Ranking
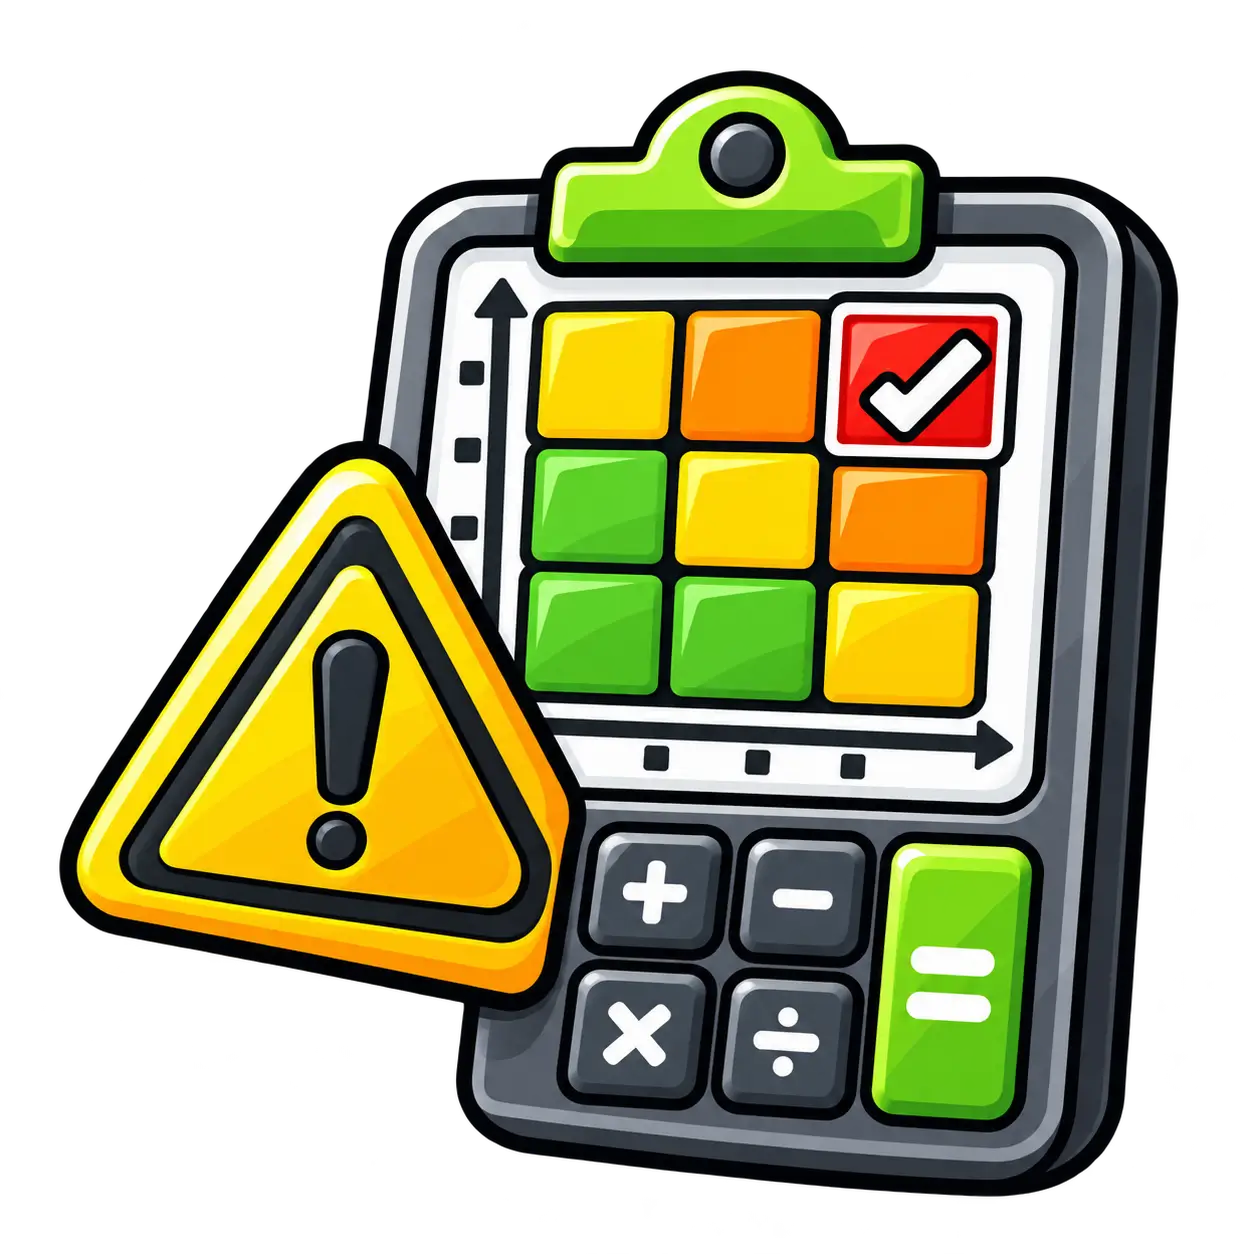
Prioritise hazards and failure modes with a clear numeric score.
- Risk Matrix Calculator5×5 (or 3×3 / 4×4) risk matrix score from Likelihood × Severity — colour-banded prioritisation for risk assessments and toolbox talks.Risk Score = Likelihood × SeverityOpen
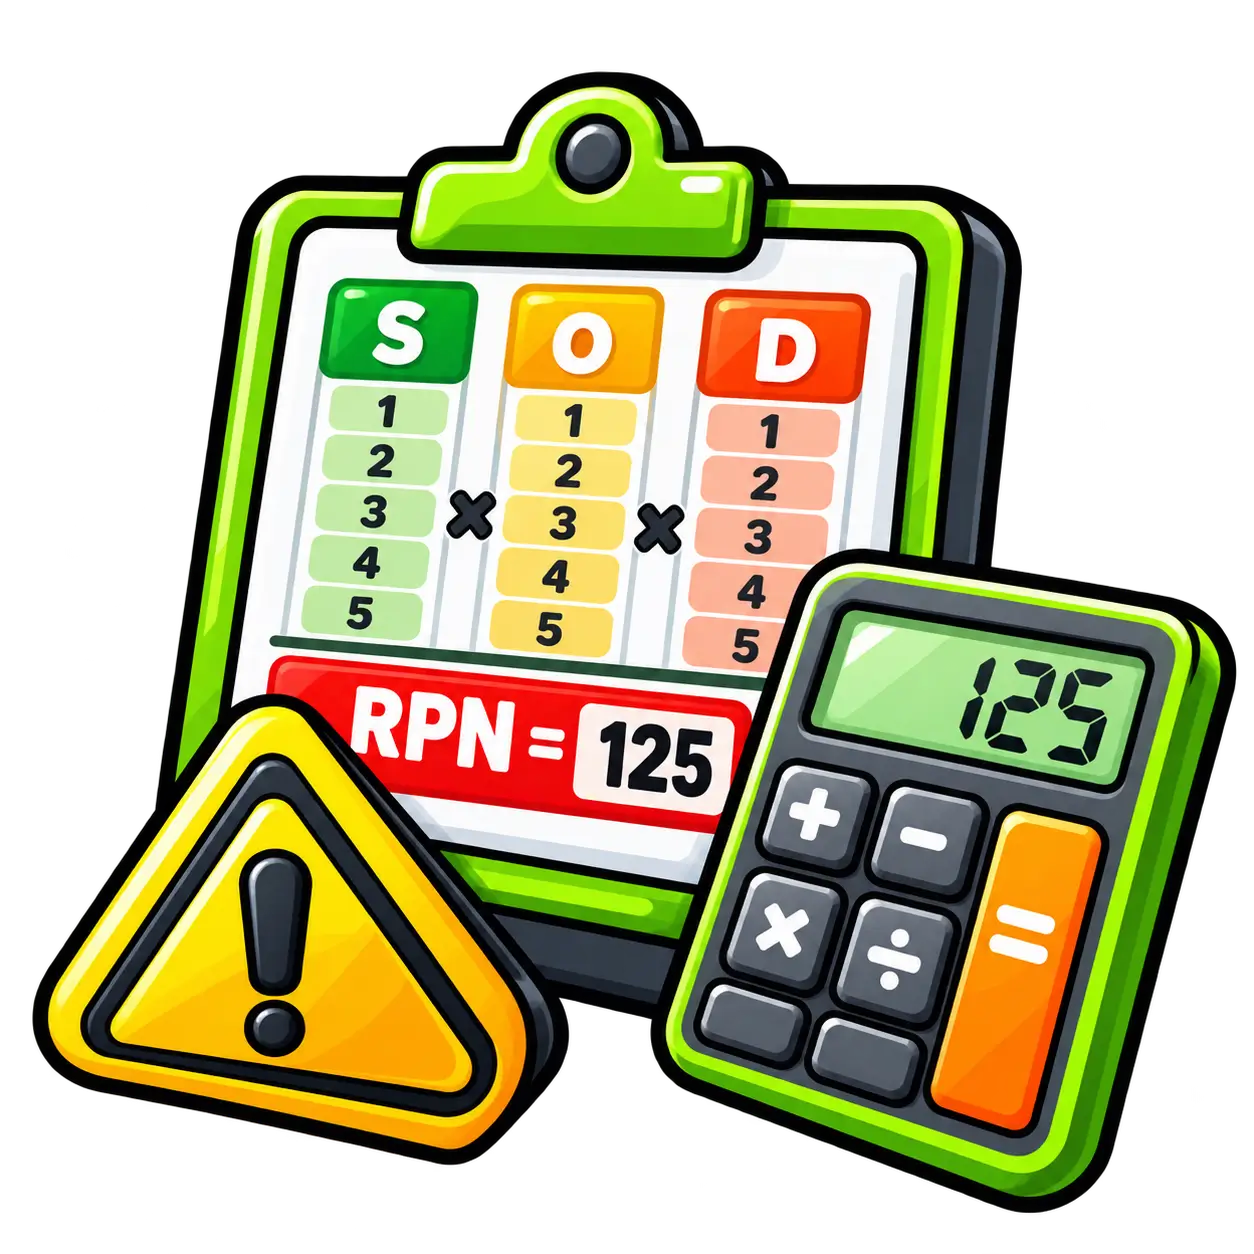
- Risk Priority Number (RPN) CalculatorCalculate the FMEA Risk Priority Number (RPN) = Severity × Occurrence × Detection. Rank failure modes, apply indicative bands, and remember high severity still needs action.RPN = Severity × Occurrence × DetectionOpen
How it works
Enter the numbers
Injuries, hours, temperatures, or exposure data — units and method choices are labelled on each tool.
Get the result
The formula runs in the browser. Where bands apply, you see good, moderate, or high at a glance.
Read the guide
Every calculator page includes the formula and notes on how safety teams use the metric.
Numbers Are Only The Start
Read how to investigate incidents, assess risk, and turn lagging indicators into action.