

TL;DR — How to Measure Safety Culture
- Measure climate directly, infer culture over time — you survey perceptions at a point; culture is read from patterns across many methods.
- Triangulate four data streams — perception surveys, interviews and focus groups, behavioral observation, and audit and indicator review.
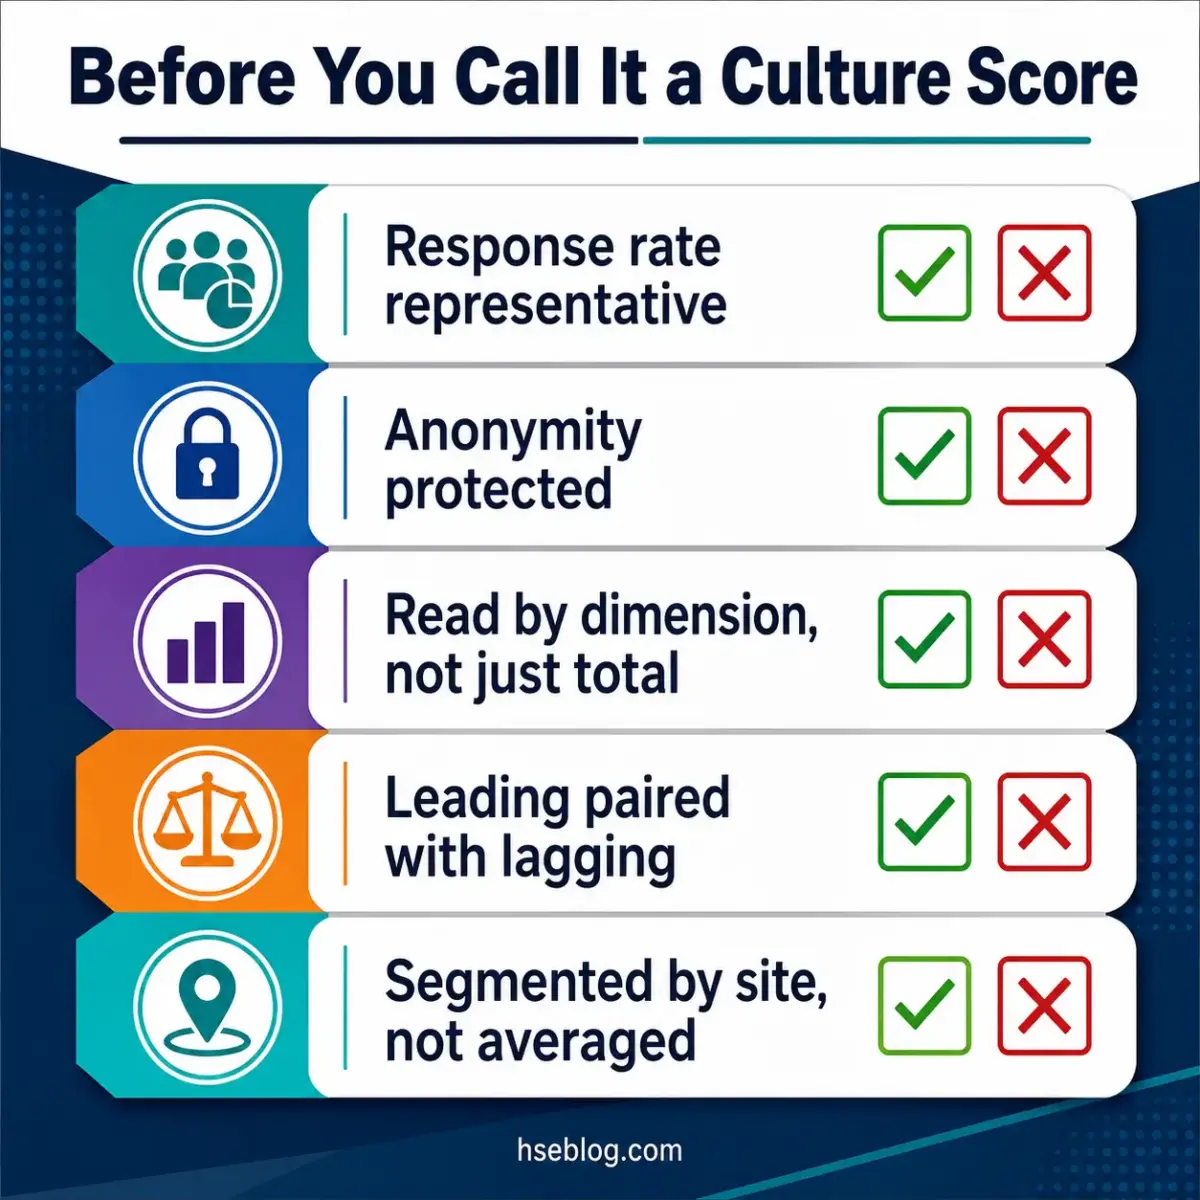
- Pair leading indicators with lagging ones — injury rates show what happened; reporting and observation rates predict what’s coming.
- Read trends and dimensions, not single scores — a strong overall number often hides one weak area that matters most.
- Match the instrument to the goal — benchmarking, certification, and small-team diagnosis each point to a different tool.
Safety culture cannot be measured by a single tool. You measure it by triangulating four data streams over time — perception surveys such as the free, validated NOSACQ-50, interviews and focus groups, behavioral observation, and audit and indicator review — then interpreting that pattern against a maturity model like the Safety Culture Ladder rather than trusting one score.
Most “culture assessments” I review are actually a single climate survey run once, scored, and reported to leadership as a verdict. That belief — that one questionnaire labelled a culture survey tells you what your culture is — is the most expensive misconception in this field, because the same instrument run a month earlier or later, or just after an incident, can hand you a very different number.
Knowing how to measure safety culture credibly matters because the measurement drives the spend: resources, training, and management attention all follow the diagnosis. A flawed reading either triggers the wrong fix or, worse, signals that everything is fine while reporting quietly collapses underneath. This article walks through the actual instruments, the methods that surround them, the leading and lagging indicators that keep them honest, the maturity models that interpret the whole picture, and the judgment calls competitors skip.

Safety Culture vs. Safety Climate: What You Are Actually Measuring
You can survey climate directly; you can only infer culture. That single distinction decides whether your numbers mean anything.
Culture is the slow-built personality of an organization — the shared values, beliefs, and habits that govern how work really gets done when no auditor is watching. Climate is the surface reading: how the workforce perceives safety at one moment, which a safety climate survey captures cleanly.
The UK regulator frames culture as the product of individual and group values, attitudes, and behaviors, drawing on the long-standing ACSNI definition that HSE guidance on safety culture and behaviour adopts. That framing matters because it tells you culture is behavioral and durable — not a mood you can poll on a Tuesday.
| Dimension | Safety Culture | Safety Climate |
|---|---|---|
| Definition | Shared values, beliefs, and behaviors built over years | Workforce perceptions captured at a single point in time |
| Timescale | Slow-changing; shifts over months and years | Volatile; can swing within weeks |
| How measured | Inferred by triangulating multiple methods over time | Measured directly via a safety perception survey |
| What it tells you | The underlying “way things really get done” | A snapshot signal that points toward culture |
The failure mode here is constant: a team runs one perception survey, calls it a culture assessment, and treats the composite score as a final grade. Run that same instrument days after a serious incident, or during a feel-good safety week, and the numbers move sharply — which is exactly why a single-point climate reading should never be reported as a measure of culture.
The Core Methods for Measuring Safety Culture
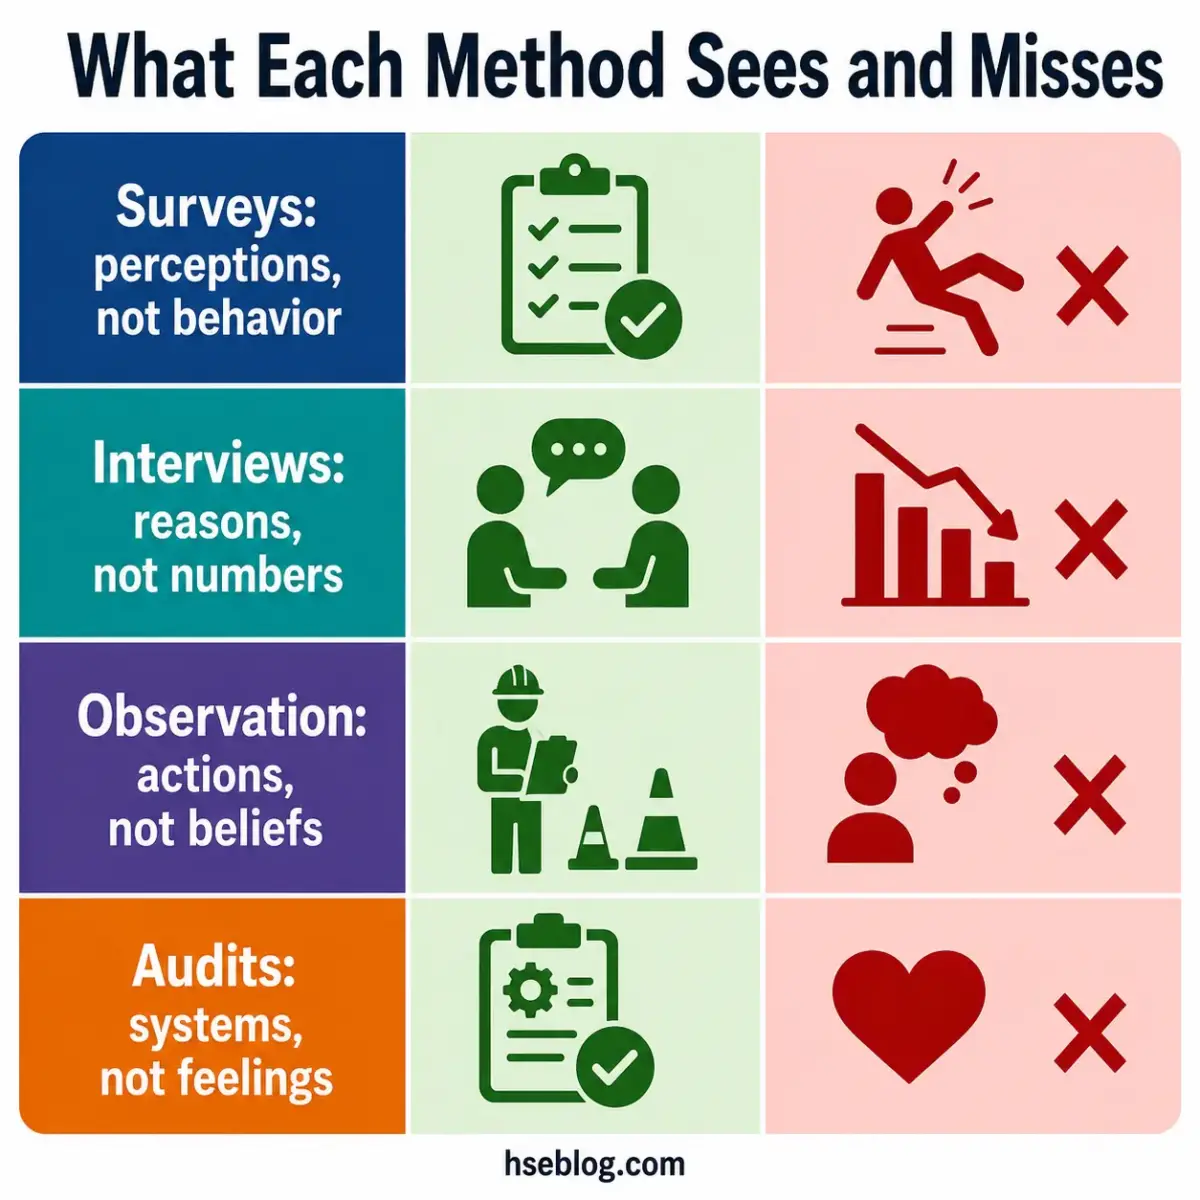
The problem no single method solves: each one is blind to something. Perception surveys can’t see behavior, observations can’t see belief, and audits can’t see how people feel about speaking up — so you run them as complementary streams, not as a pick-one menu.
These are the four recognized safety culture measurement tools families, each capturing one slice and missing another.
Safety Climate / Perception Surveys
This is the most-used quantitative method, and the one most often misused. Named, validated instruments exist — choose one deliberately rather than writing your own untested questionnaire.
- NOSACQ-50 — Nordic-developed, 50 items across 7 dimensions, internationally benchmarkable, and free. Validation work found higher climate scores associated with fewer self-reported violations, with negative correlations roughly between −0.25 and −0.66 (Kines et al., Journal of Safety Research, 2011). You can access the free, validated NOSACQ-50 instrument from the Nordic research centre directly.
- HSE (UK) climate-tool lineage — the seven-dimension model rooted in UK regulator work, widely adapted into in-house surveys.
- SAQ (Safety Attitudes Questionnaire) — US origin, developed in healthcare, strong where clinical risk dominates.
- NSC Safety Barometer and dss+ survey — commercial, large-benchmark options when comparison against a wide external database is the priority.
The guardrails decide validity more than the instrument choice does:
- Protect anonymity — without a credible anonymity threshold, people answer the way they think is safe, not the way they believe.
- Secure a representative response — a low or skewed response rate invalidates the result regardless of how good the questionnaire is.
- Read trends over time — a one-off score is a data point; the slope across cycles is the signal.
- Read dimensions, not just the composite — the actionable insight usually sits in a single weak area.
A pattern I see repeatedly: leadership fixates on the headline number while the warning lives in one dimension — strong “management commitment” sitting next to weak “reporting confidence.” Average those together and the most important finding disappears.
Interviews and Focus Groups
Surveys tell you what; people tell you why. This qualitative layer explains the scores a questionnaire produces.
- Run them after the survey — use focus groups to interpret anomalies, not to gather raw data first.
- Surface the unwritten rules — interviews expose “the way things really get done” that no closed question reaches.
- Probe the gaps — where a dimension scored low, structured discussion reveals whether it’s a systems problem or a trust problem.
Behavioral Observation and Safety Tours
Here you measure work as actually done, including what doesn’t happen. Behavioral safety observation treats action as data.
- Use structured sampling — checklists and defined observation windows beat informal walkarounds.
- Count leadership presence — visible, recorded senior site time is itself a measurable behavior.
- Treat absence as evidence — if no one stops an unsafe job, that silence is a finding, not a non-event.
Document, Audit, and Indicator Review
This is the systems-and-outcomes layer that connects culture to the record. A safety culture audit reviews systems against criteria; the records around it carry cultural signal.
- Corrective-action closure time — how fast findings actually get fixed.
- Training quality, not just completion — a 100% completion rate says nothing about competence.
- Near-miss reporting rates — rising reports usually mean rising trust, not rising danger.
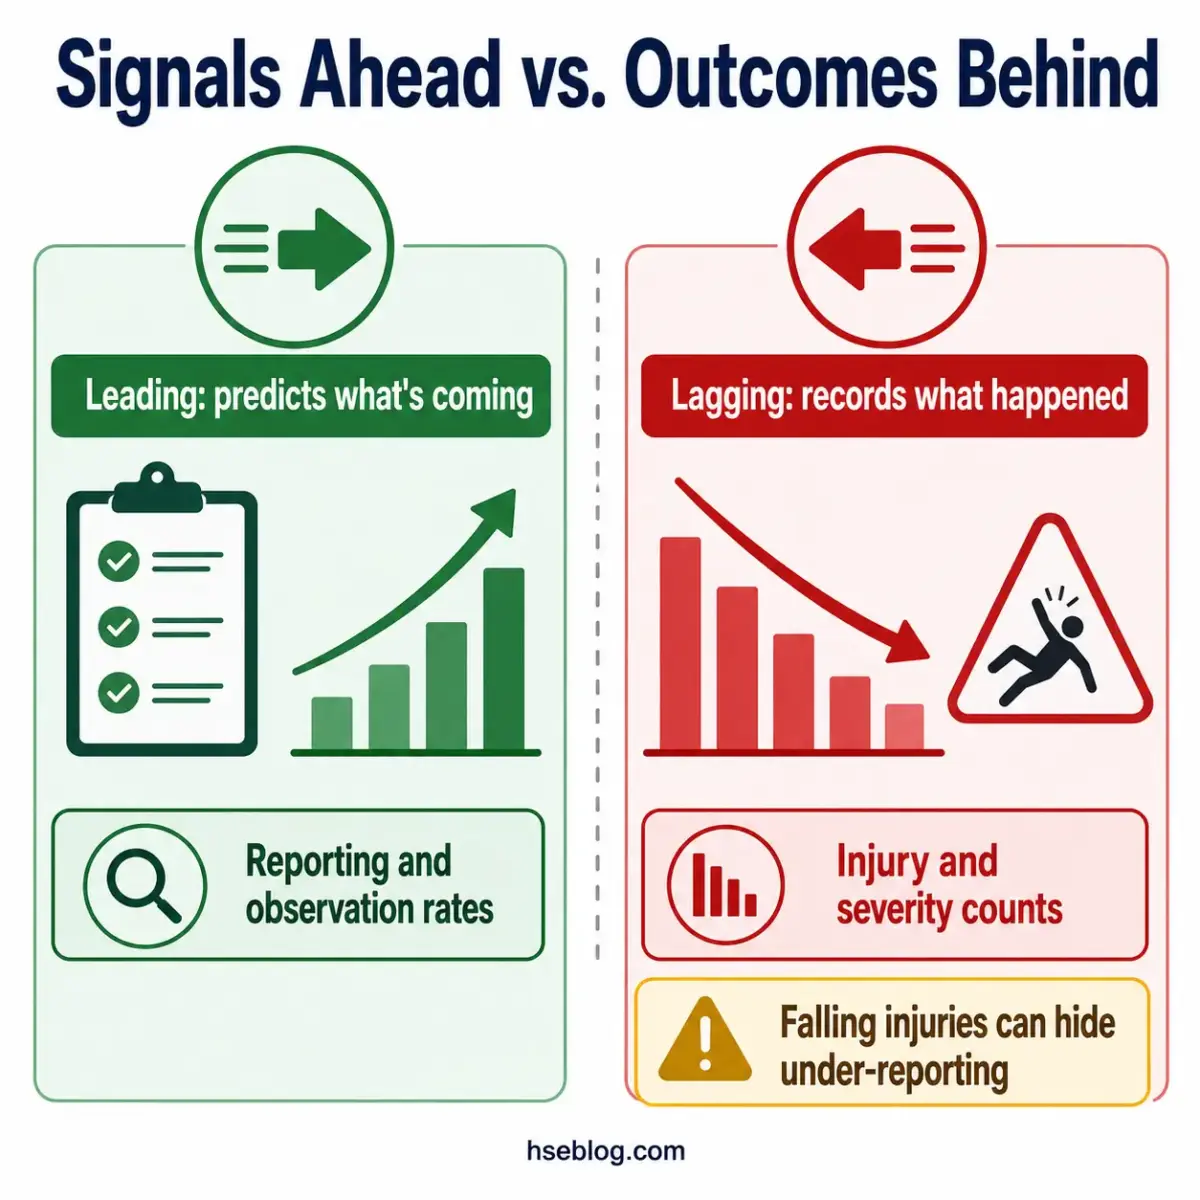
Leading vs. Lagging Indicators: Why Injury Rates Alone Mislead
Higher safety-climate survey scores have been shown to predict lower employee injury rates 6–12 months later (Yale School of Public Health, Occupational and Environmental Medicine, 2016). That directional finding is the whole argument: perception today forecasts outcomes tomorrow, while injury counts only report yesterday.
Lagging indicators measure outcomes after harm. They are backward-looking by definition and tell you nothing about the trajectory of your culture.
| Leading Indicators (predictive) | Lagging Indicators (outcome) |
|---|---|
| Near-miss and hazard reporting rates | Lost-time injury frequency rate (LTIFR) |
| Behavioral observation frequency | Recordable incident counts |
| Leadership safety visits logged | Injury severity and lost days |
| Time-to-corrective-action | Absenteeism linked to incidents |
| Training quality and competence checks | Insurance and claims data |
The dangerous read is a falling injury rate. Low counts can mask under-reporting — and under-reporting is itself a culture failure, not a success.
This is the reversion trap Hudson explicitly warns about in the maturity literature: management posts good lagging numbers, eases off, and the system quietly degrades. Improving lagging data should raise your scrutiny, not relax it — pair every outcome metric with leading indicators of safety culture before you draw any conclusion.
Safety Culture Maturity Models: Measuring the Direction of Travel
In practice, a maturity model is where your mixed data becomes a diagnosis — a “where are we, where next” reading rather than a measurement instrument in its own right. You feed survey, behavior, and systems evidence into it and place the organization against defined level descriptors.
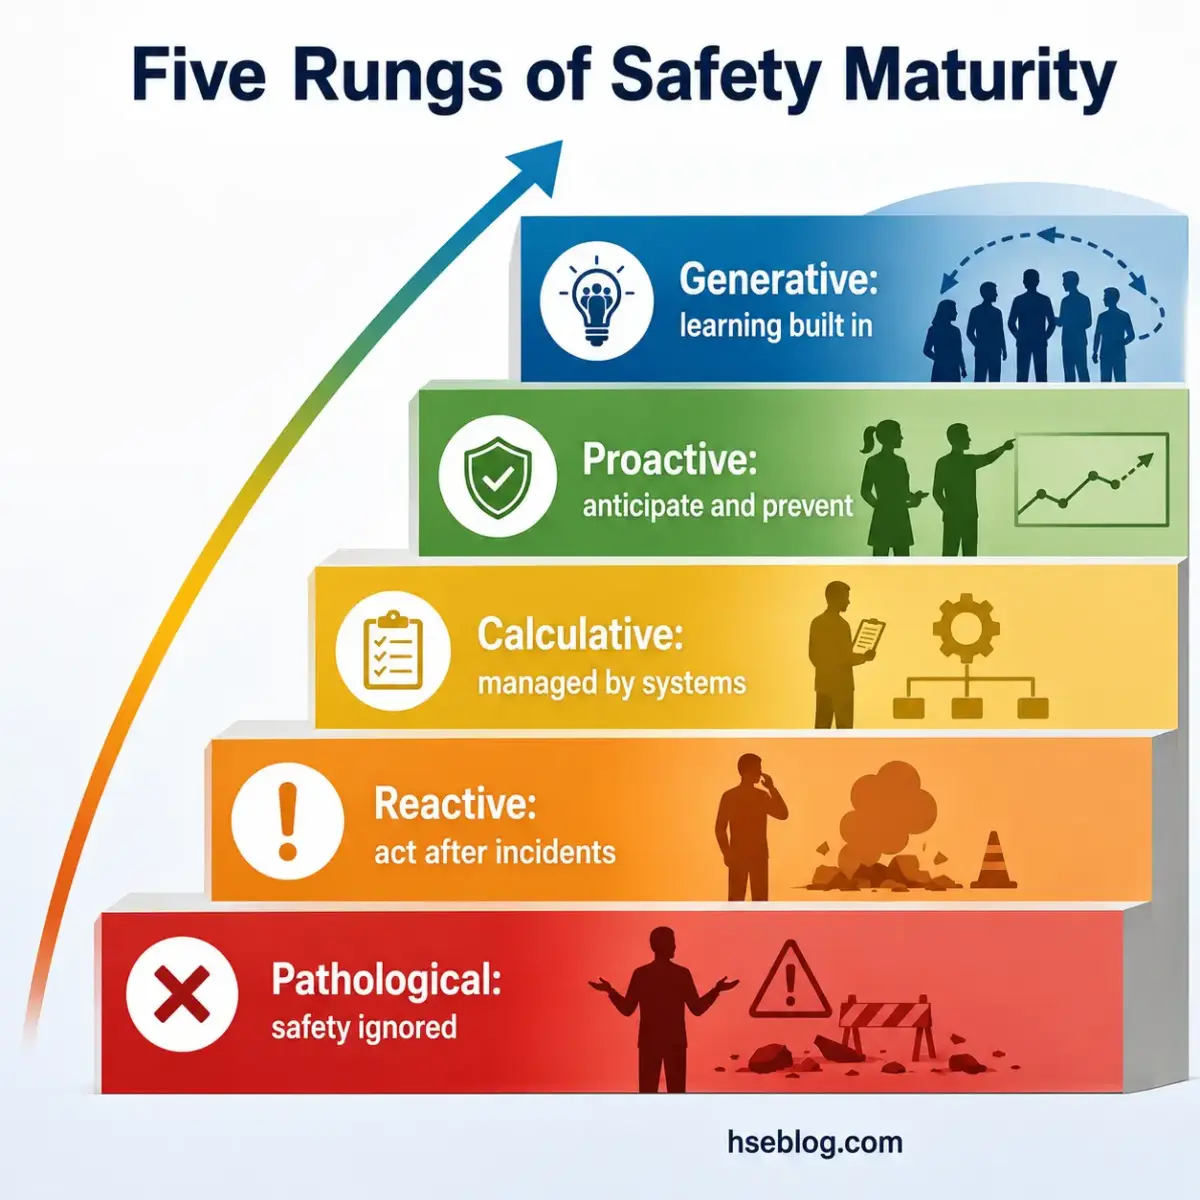
The canonical safety culture maturity model is the Hudson and Parker ladder, popularized as the Hearts and Minds programme and built on Westrum’s typology of how organizations handle information. It now sits within an Energy Institute toolkit and runs across five levels:
- Pathological — “Why waste time on safety?” Safety matters only when caught.
- Reactive — Safety taken seriously after something goes wrong.
- Calculative — Systems and data in place; safety managed by the numbers.
- Proactive — The workforce anticipates and prevents; improvement is sought out.
- Generative — Safety is woven into everything; near-misses are shared as learning.
The DuPont Bradley Curve runs a parallel logic — Reactive, Dependent, Independent, Interdependent — emphasizing the shift from rules-driven compliance to a workforce that owns safety collectively. Both the Hudson safety culture ladder and the Bradley Curve are interpretive frames, not scored tests.
Maturity is assessed through structured methods: card-sort workshops, facilitated discussion, and scoring against level descriptors with evidence attached.
The discipline most teams lack is honest placement. Organizations routinely self-rate a level too high; the practitioner’s job is anchoring every claimed level to observable evidence — recorded behaviors, closure times, reporting trends — rather than to an aspirational self-image.
Conceptual Ladder vs. Certifiable Scheme — Don’t Confuse Them
The academic ladder is a thinking tool. The Safety Culture Ladder (SCL), administered by NEN, is an audited certification scheme — and conflating the two is one of the most common errors in this space.
- The conceptual ladder helps you reason about direction of travel; it has no audit, no certificate, no validity period.
- The certifiable SCL originated in the Dutch rail sector, now spans multiple sectors internationally, and grades maturity through independent accredited audit.
SCL has changed materially. SCL 2.0 replaced points-based scoring with a color-based assessment — green, orange, red — and reduced the culture themes from six to five (NEN, 2023–2024). SCL 2.0 took effect for new certification in 2024, with all valid certificates required to be SCL 2.0 by 1 January 2028. You can confirm current steps and transition dates through the NEN Safety Culture Ladder scheme.
Regulatory and certification content here reflects general HSE professional understanding of the relevant standards as of the review date above. It is not legal or compliance advice. Holding a certificate is not the same as legal compliance, and requirements change — verify specific obligations against the current standard text and qualified counsel in the applicable jurisdiction.
How to Combine Methods: Triangulation in Practice
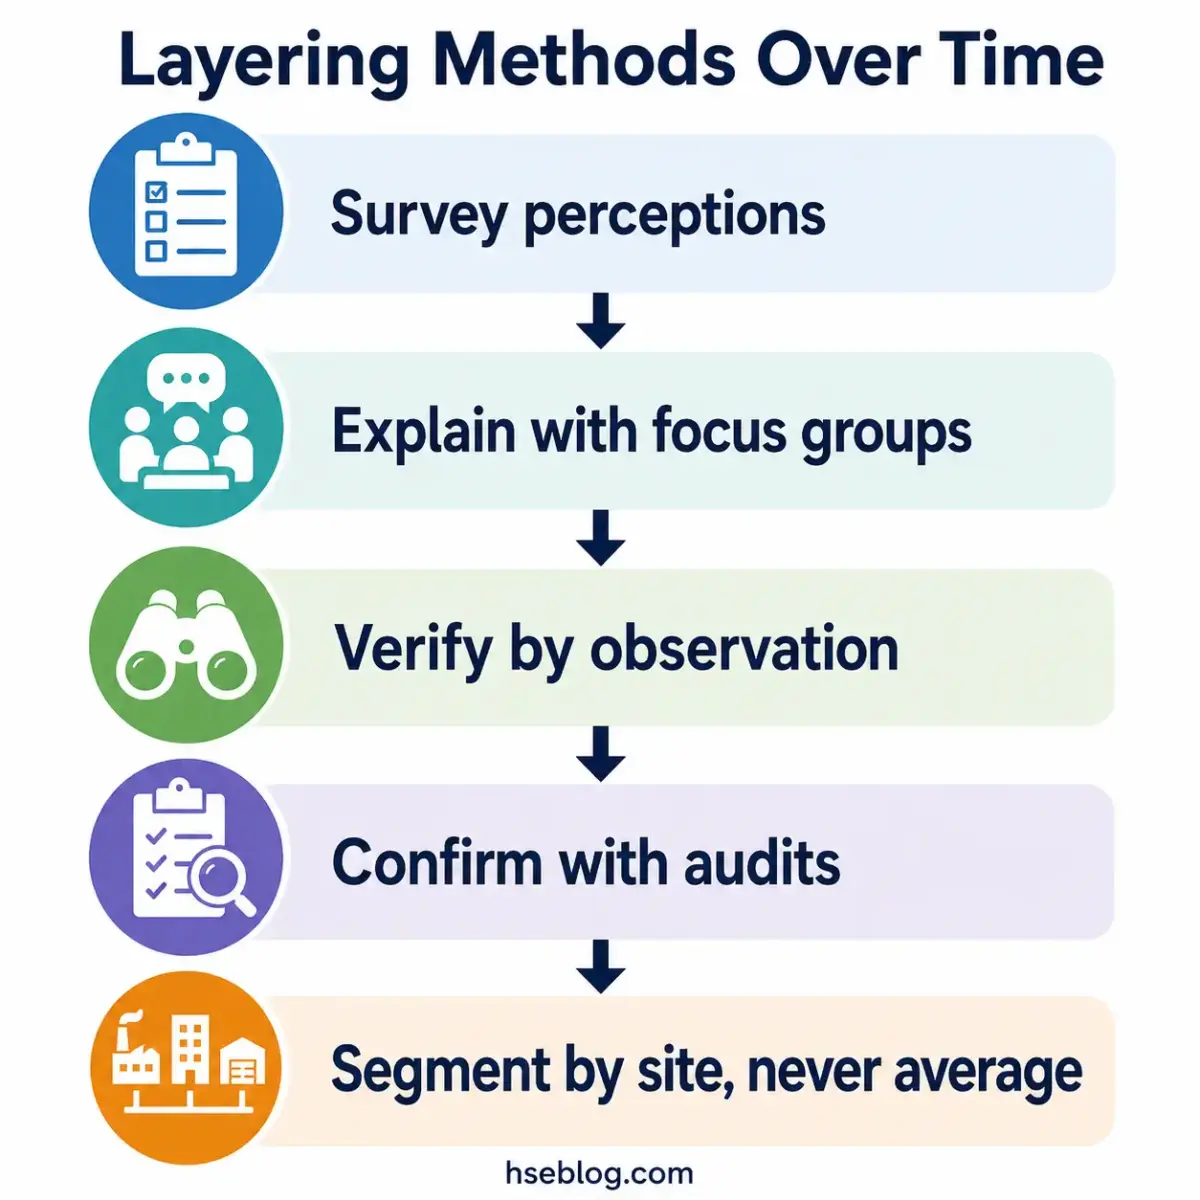
The synthesis the thin competitors skip is triangulation — layering methods so each one covers another’s blind spot. A survey score you can’t explain is just a number until a focus group tells you why it landed there.
Built well, the layering follows a logic:
- Start with perception — a climate survey gives you the breadth and the dimensions to investigate.
- Explain with people — focus groups and interviews interpret the anomalies the survey surfaced.
- Verify with behavior — observation tests whether stated attitudes match observed action.
- Confirm with systems — audit and indicator review checks whether the records support the story.
- Interpret against a ladder — place the combined picture on a maturity model to set direction.
Cadence keeps the program credible without exhausting the workforce.
| Method | Frequency | What it answers |
|---|---|---|
| Climate / perception survey | Every 6–12 months | How do people perceive safety now? |
| Deeper culture assessment | Annually to ~18 months | Where are we on the maturity path? |
| Leading-indicator review | Weekly to monthly | Are the early signals moving? |
| Focus groups | After each survey | Why did the scores land here? |
Segment everything by site and function. An org-wide average is where actionable insight goes to die — the unit that needs help is the one whose poor score gets diluted into a comfortable company mean and then reported to the board as “fine.”
Choosing the Right Tool for Your Organization
There is no valid one-size-fits-all instrument, and any vendor implying otherwise is selling, not advising. The right choice falls out of your goal, your size, and your sector.
- If you want free, benchmarkable measurement — use NOSACQ-50; it’s validated, internationally comparable, and costs nothing.
- If you need a large external benchmark database — a commercial survey such as the NSC Safety Barometer or dss+ survey fits better.
- If your goal is certification — the Safety Culture Ladder (SCL) is the audited route, not a conceptual model.
- If you’re a small organization without a platform budget — structured focus groups, management interviews, and behavioral observation give a credible read without a paid survey.
- If sector risk is specialized — let context choose: SAQ suits healthcare, while oil and gas and construction often lean on climate surveys plus observation.
Size used to be a barrier to formal schemes; that’s shifting. NEN introduced renewed, more accessible SCL products from 1 June 2025, explicitly aimed at making the ladder usable for smaller organizations — worth checking if certification once looked out of reach.
Frequently Asked Questions
The Lesson Worth Keeping
The recurring industry failure isn’t a lack of tools — it’s treating one climate snapshot as the verdict on how to measure safety culture. The same questionnaire that scores well during a good week scores poorly after an incident, and reporting a single composite to leadership buries the one weak dimension or struggling site that actually needed the attention.
The highest-impact change is also the cheapest: stop reporting a number and start reporting a pattern. Triangulate perception, behavior, systems, and indicators; read trends and dimensions rather than headline scores; segment by site so the unit in trouble can’t hide inside an average; and pair every leading indicator with a lagging one so improving injury data raises scrutiny instead of complacency.
Do that consistently and the maturity models stop being wall art — they become an honest reading of direction. A defensible measurement program won’t tell you your culture is perfect; it will tell you, site by site, exactly where to look next.