

TL;DR:
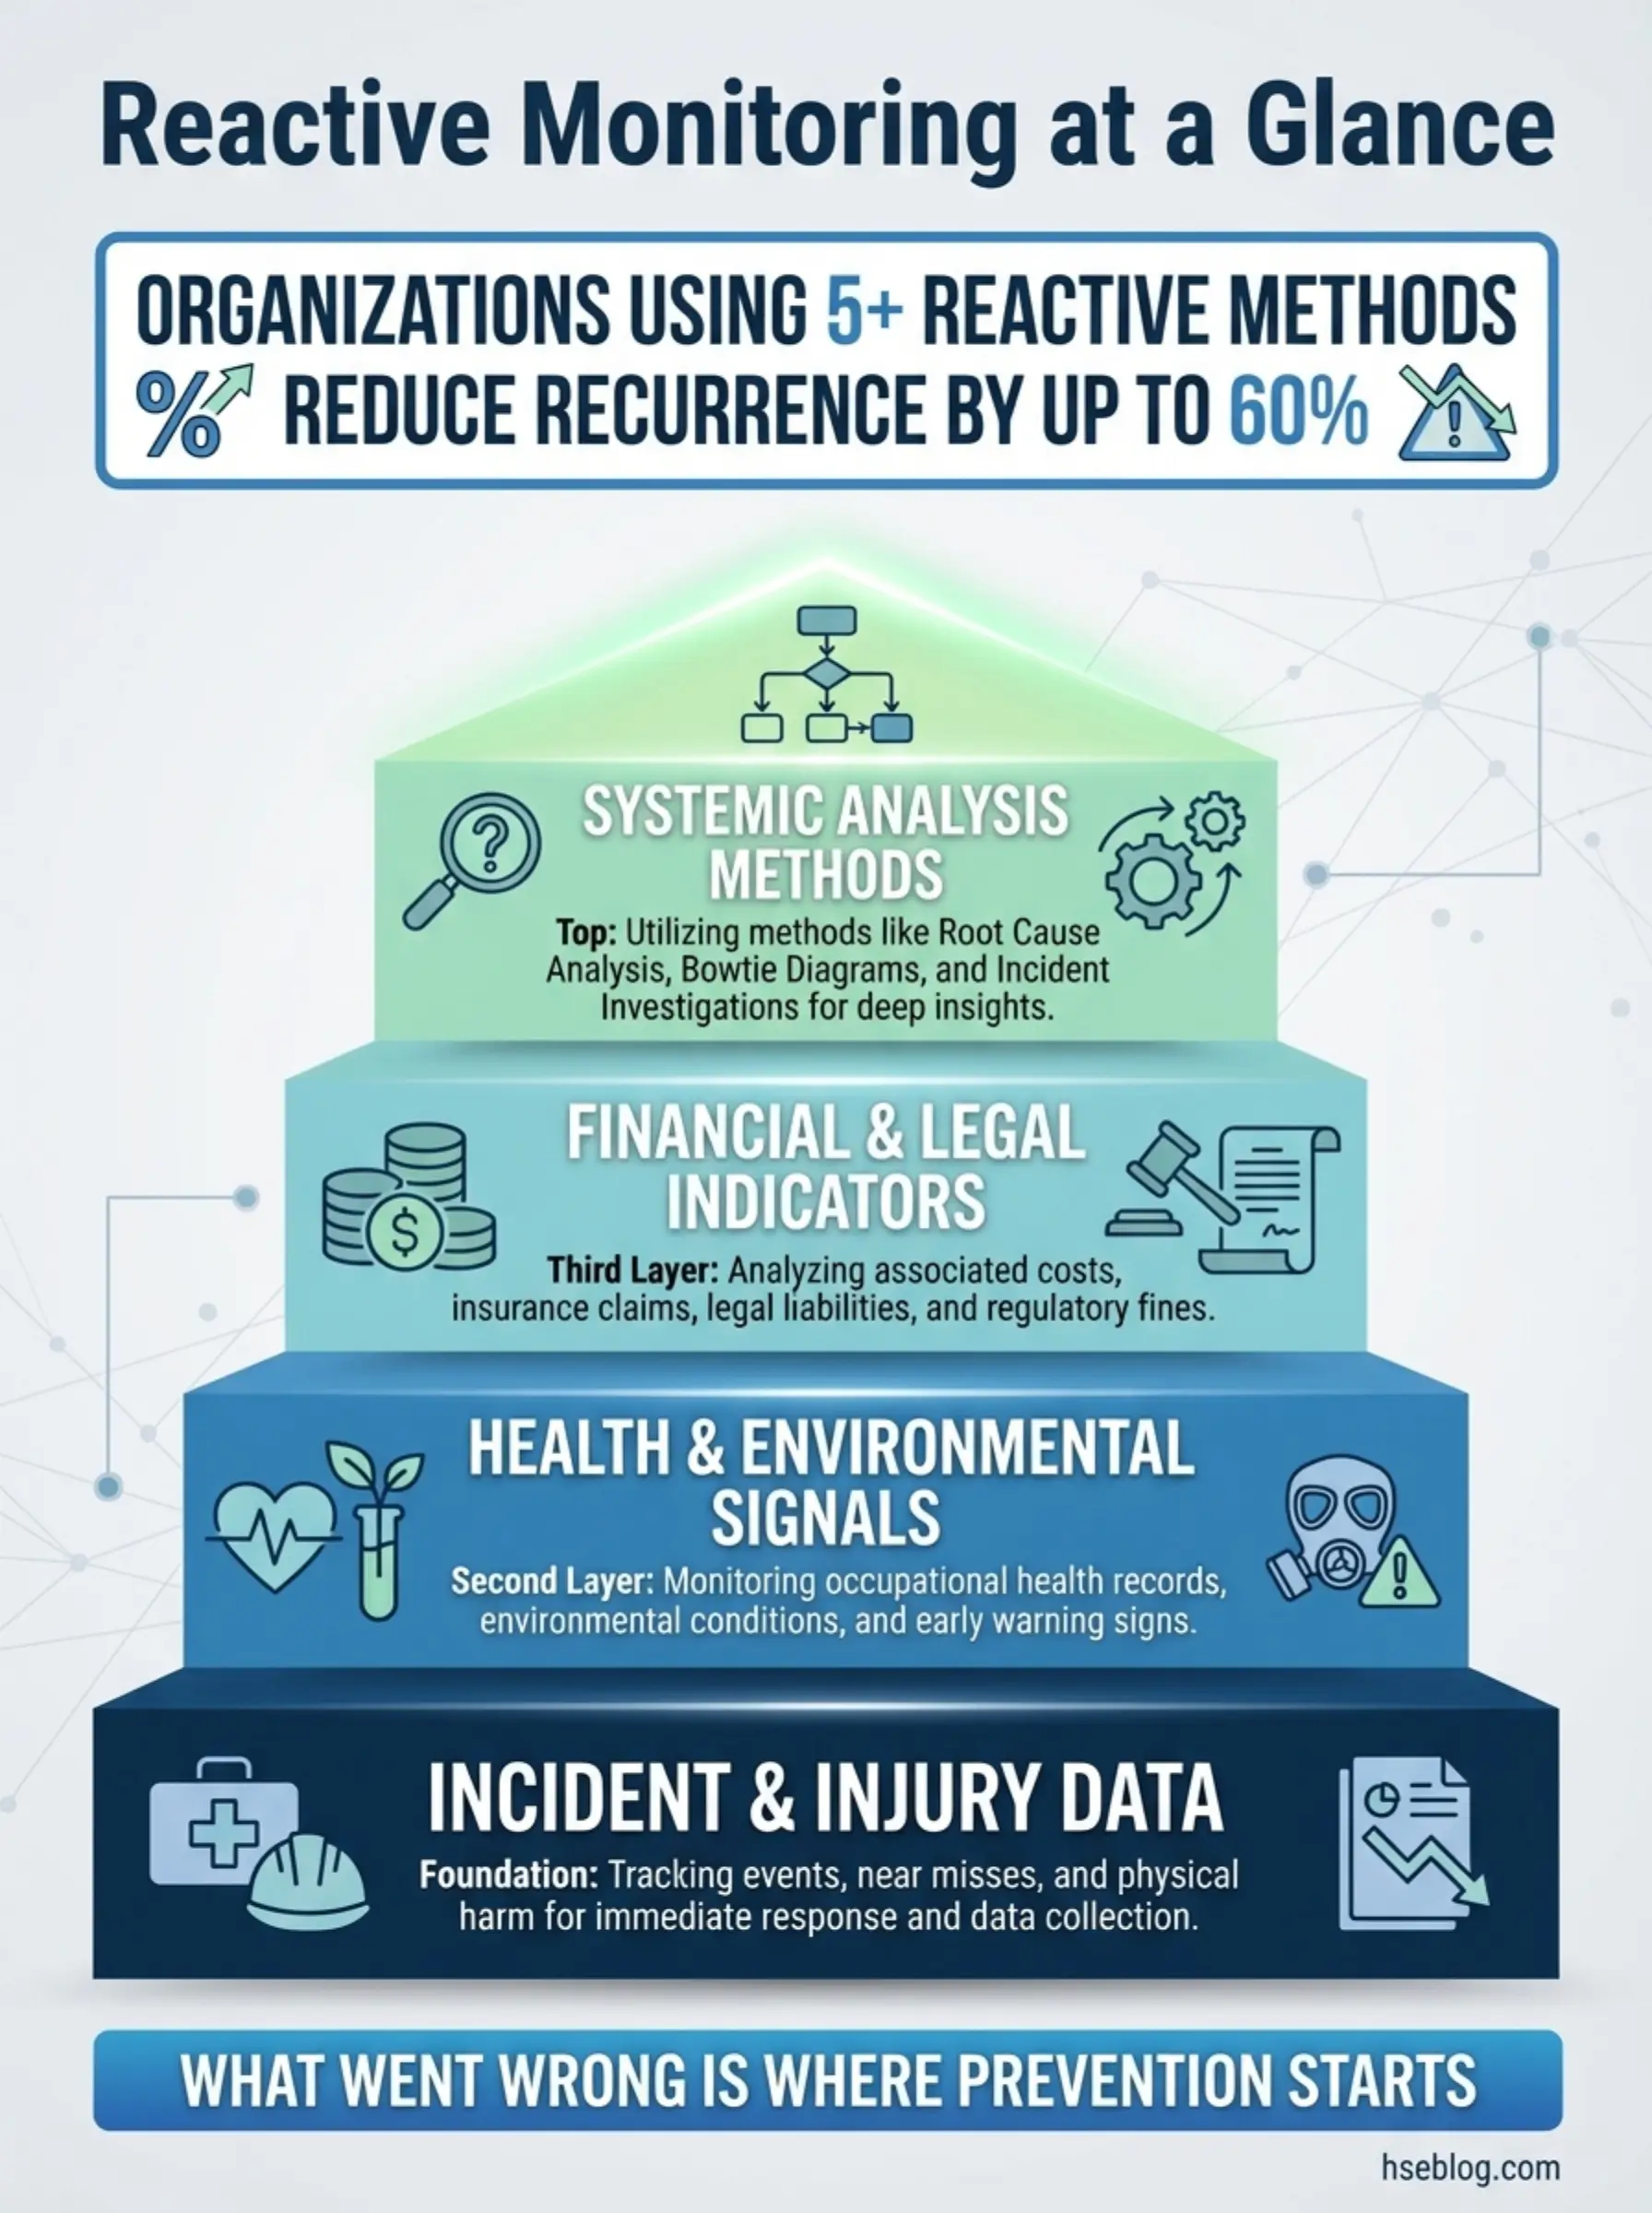
- Reactive monitoring captures what already went wrong — injuries, near-misses, ill health, property damage, and enforcement actions that reveal system failures.
- Fifteen distinct methods exist, each targeting a different failure signal that proactive systems missed.
- Near-miss and first aid reporting catch failures early before they escalate into fatalities or major losses.
- Effective reactive monitoring requires honest reporting culture, not punitive systems that suppress the data you need most.
- Every reactive data point is a prevention opportunity — but only if the organization investigates, learns, and acts on findings.
I was sitting in a site office on a petrochemical complex in the Gulf, reviewing a contractor’s monthly safety report. The numbers looked impressive — zero lost-time injuries, zero recordable incidents, zero near-misses. On paper, it was a perfect operation. Then I walked the site. Within forty minutes, I found a scaffold missing two guardrail sections, a pressure gauge reading well above the safe operating envelope, and a crew working inside a vessel with no standby attendant. That contractor didn’t have zero incidents. They had zero reporting.
That experience captures the central problem with reactive monitoring — and why understanding each method matters so much. Reactive monitoring methods are the tools organizations use to collect, analyze, and learn from events that have already occurred: the accidents, ill health cases, near-misses, enforcement actions, and property losses that signal breakdowns in the safety management system. When used correctly, these fifteen reactive monitoring methods become a powerful feedback loop that prevents recurrence and exposes systemic weaknesses. When ignored, misused, or suppressed, they leave organizations blind to the exact failures that will produce the next fatality. This article covers every major type, how each works in real operations, where organizations get them wrong, and how to turn reactive data into genuine prevention.
What Is Reactive Monitoring in Health and Safety?
Reactive monitoring is the systematic process of collecting and analyzing data from events that have already caused harm, loss, or near-harm. It sits on the opposite side of the monitoring spectrum from proactive monitoring, which measures compliance and performance before failures occur.
The distinction matters because both serve different purposes within a health and safety management system. The key characteristics that define reactive monitoring methods include:
- Event-driven activation: Data collection triggers only after an incident, near-miss, ill health case, or loss has occurred — never before.
- Lagging indicator focus: Reactive monitoring produces lagging indicators of safety performance, which measure outcomes rather than effort or compliance.
- Failure-signal detection: Each method captures a specific type of system failure — whether it’s a physical injury, a regulatory breach, a financial loss, or an occupational disease.
- Root cause orientation: The purpose is not just to record what happened, but to investigate why it happened and what systemic controls failed.
- Legal and regulatory obligation: Many reactive monitoring methods carry legal reporting requirements under OSHA, HSE UK’s RIDDOR, EU Framework Directive 89/391, and equivalent national legislation.
Under ISO 45001:2018 Clause 9.1.2, organizations must establish processes for incident investigation and must use monitoring, measurement, analysis, and evaluation results as inputs for management review — making reactive monitoring a management system requirement, not an optional add-on.
Pro Tip: If your reactive monitoring data consistently shows “zero,” question the system, not the safety. I have never encountered a high-risk operation that genuinely produces zero adverse events over sustained periods. Zero reporting almost always means suppressed reporting.
1. Accident and Injury Reporting and Investigation
Accident and injury reporting is the most recognized reactive monitoring method across every industry. It captures events where a worker or third party has sustained physical harm — from minor lacerations to fatalities.
The effectiveness of this method depends entirely on what happens after the report is filed. During an audit of a manufacturing facility in Central Europe, I found over two hundred injury reports filed in a twelve-month period. Not a single one had a completed investigation form attached. The data existed, but the learning didn’t.
Strong accident reporting systems share these characteristics:
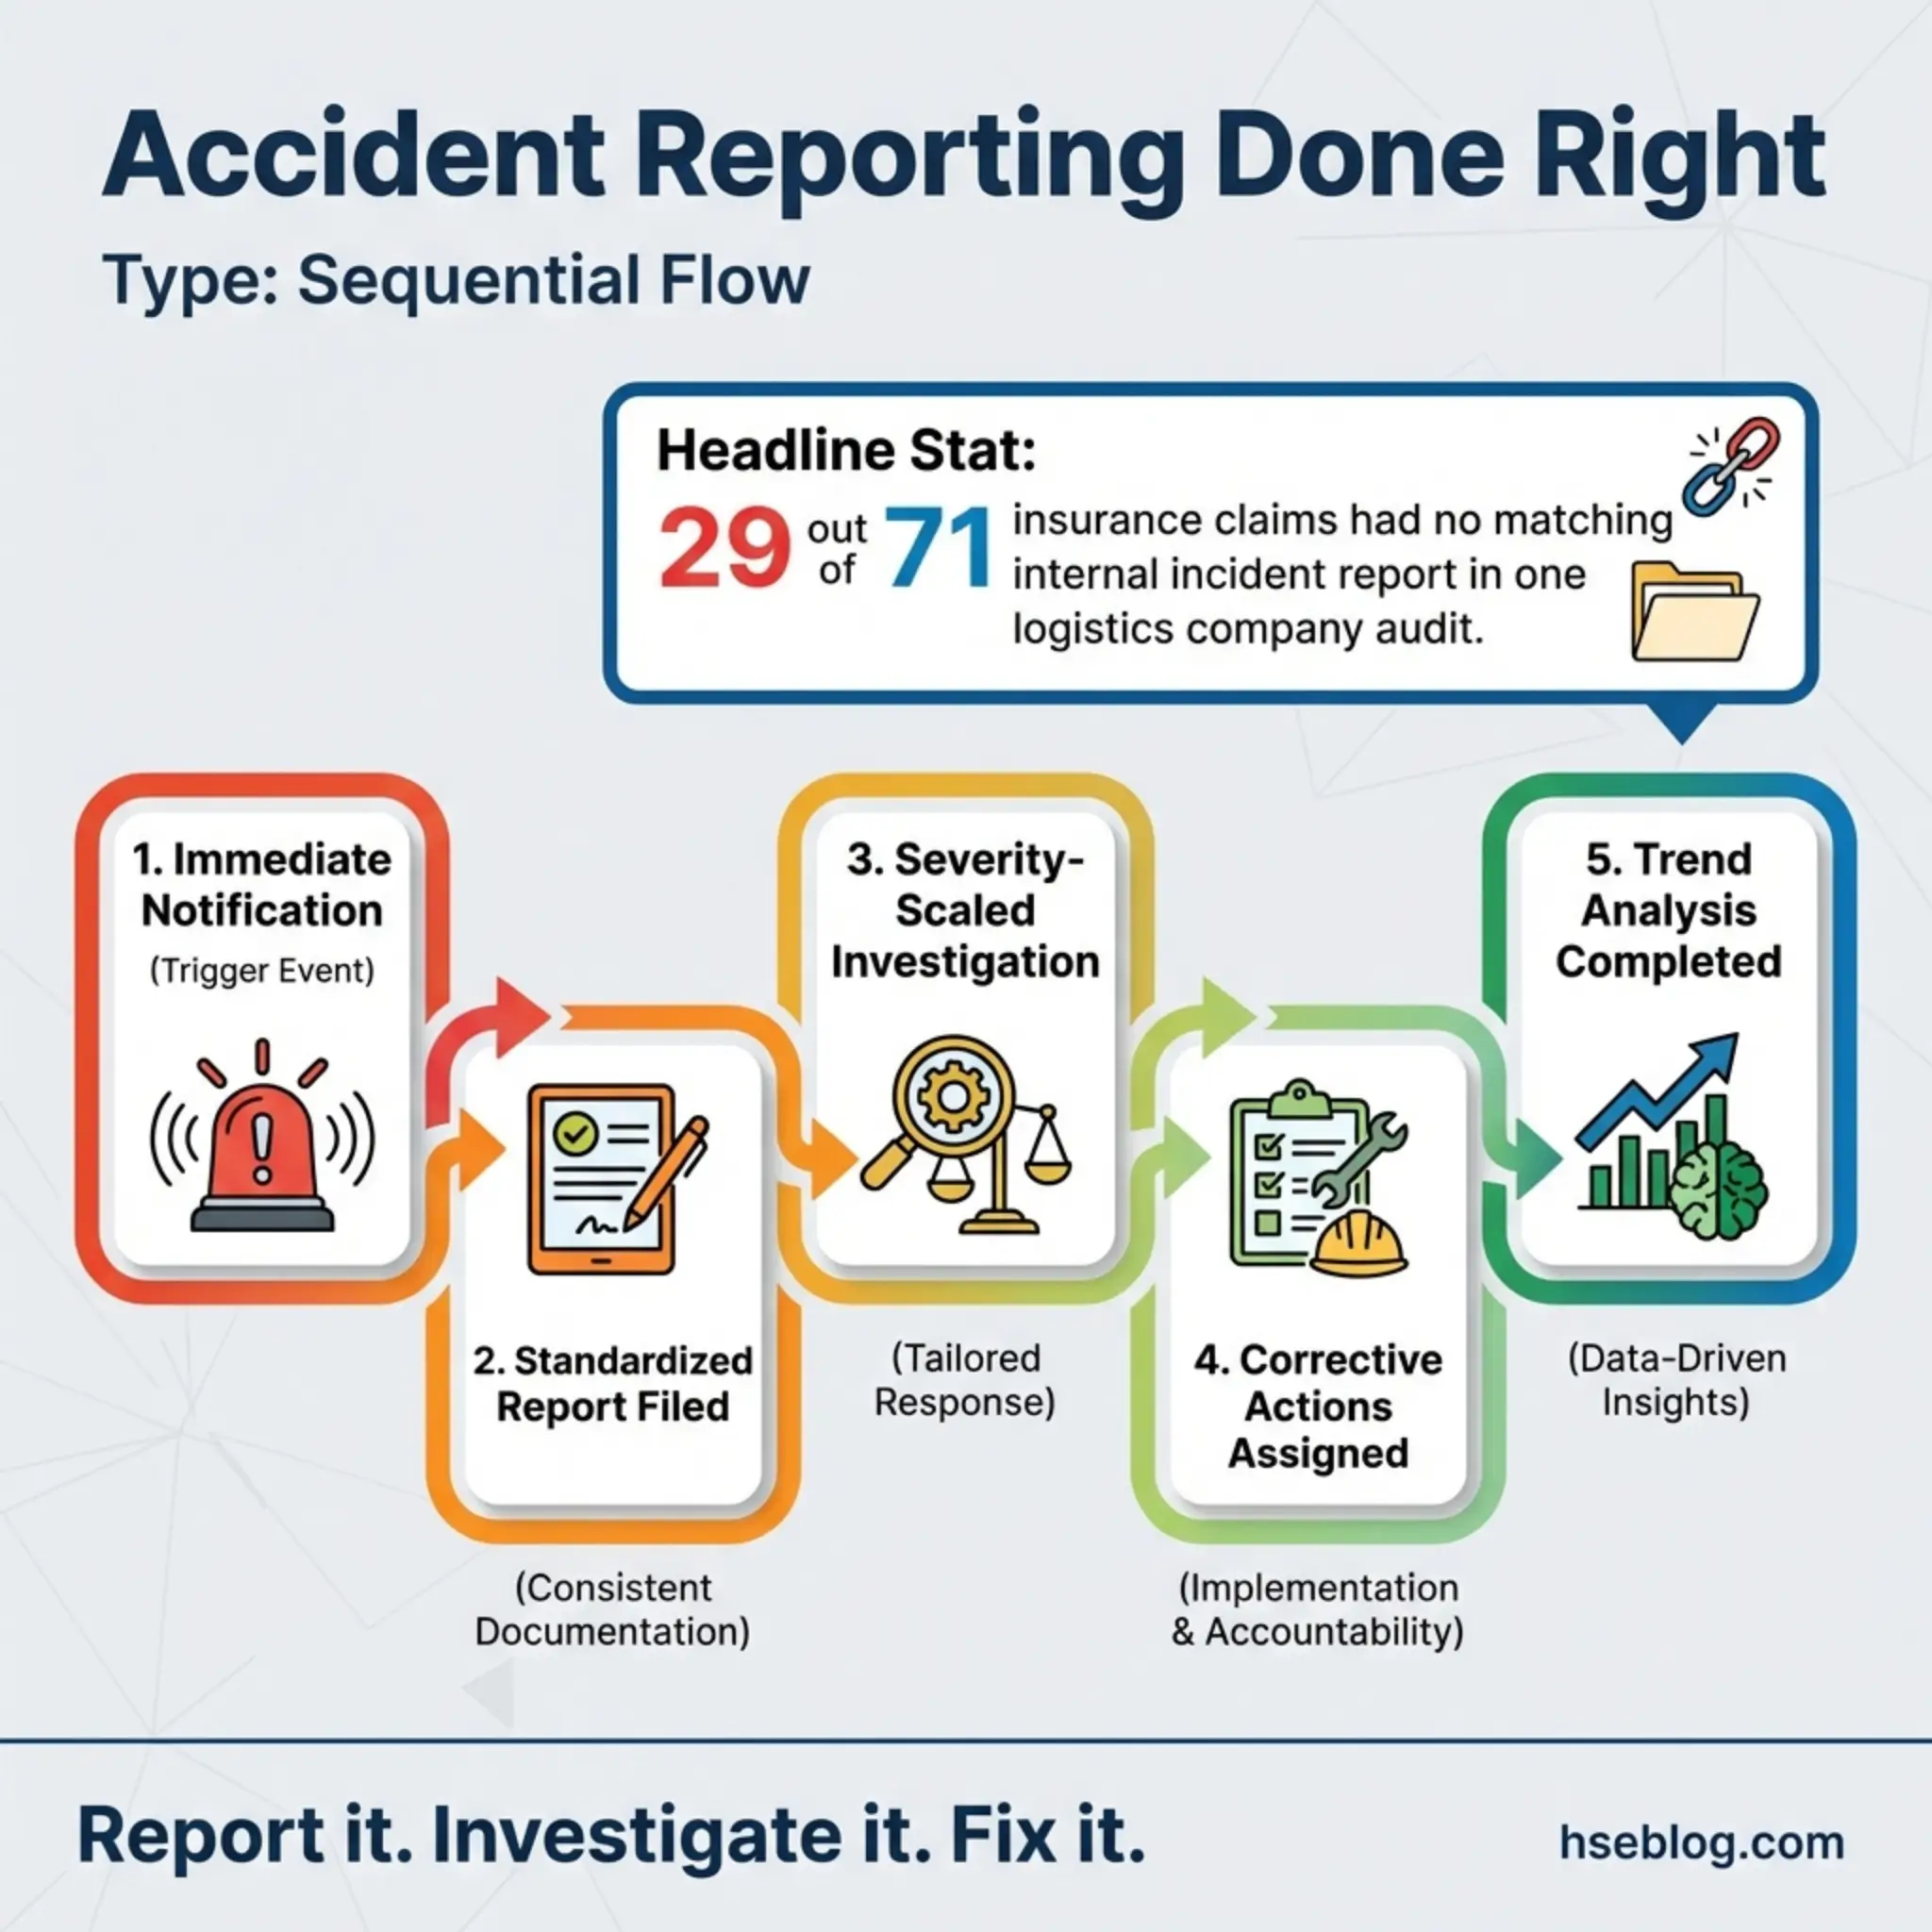
- Immediate notification protocol: A defined chain of communication that activates within minutes of the event — not at the end of the shift or the following morning.
- Standardized reporting forms: Structured capture of who, what, when, where, and immediate cause — using consistent categories that allow trend analysis across sites and time periods.
- Investigation depth scaled to severity: Minor injuries receive basic cause analysis; serious injuries and fatalities trigger full root cause analysis with timeline reconstruction, witness interviews, and evidence preservation.
- Corrective action tracking: Every investigation must produce corrective actions with assigned owners, deadlines, and verification mechanisms.
- Trend analysis and reporting cycles: Monthly and quarterly analysis of injury types, body parts affected, work activities involved, and contributing factors.
Pro Tip: Separate the reporting function from the investigation function. When the same person who fills out the form is also responsible for investigating the cause, the report tends to be shaped by what the investigator already believes happened — introducing confirmation bias from the first sentence.
2. Near-Miss and Good Catch Reporting
Near-miss reporting captures events where harm did not occur but easily could have. A dropped load that misses a worker by a meter. A forklift that nearly strikes a pedestrian at a blind corner. An energized circuit discovered during maintenance that should have been isolated. These are the advance warnings that accident data cannot provide.
I’ve managed near-miss programs on large construction projects where the reporting rate climbed from twelve per month to over two hundred per month — not because the site became more dangerous, but because the workforce trusted the system enough to report honestly. That shift changed everything about how we allocated resources and where we focused inspections.
Effective near-miss systems depend on several critical elements:
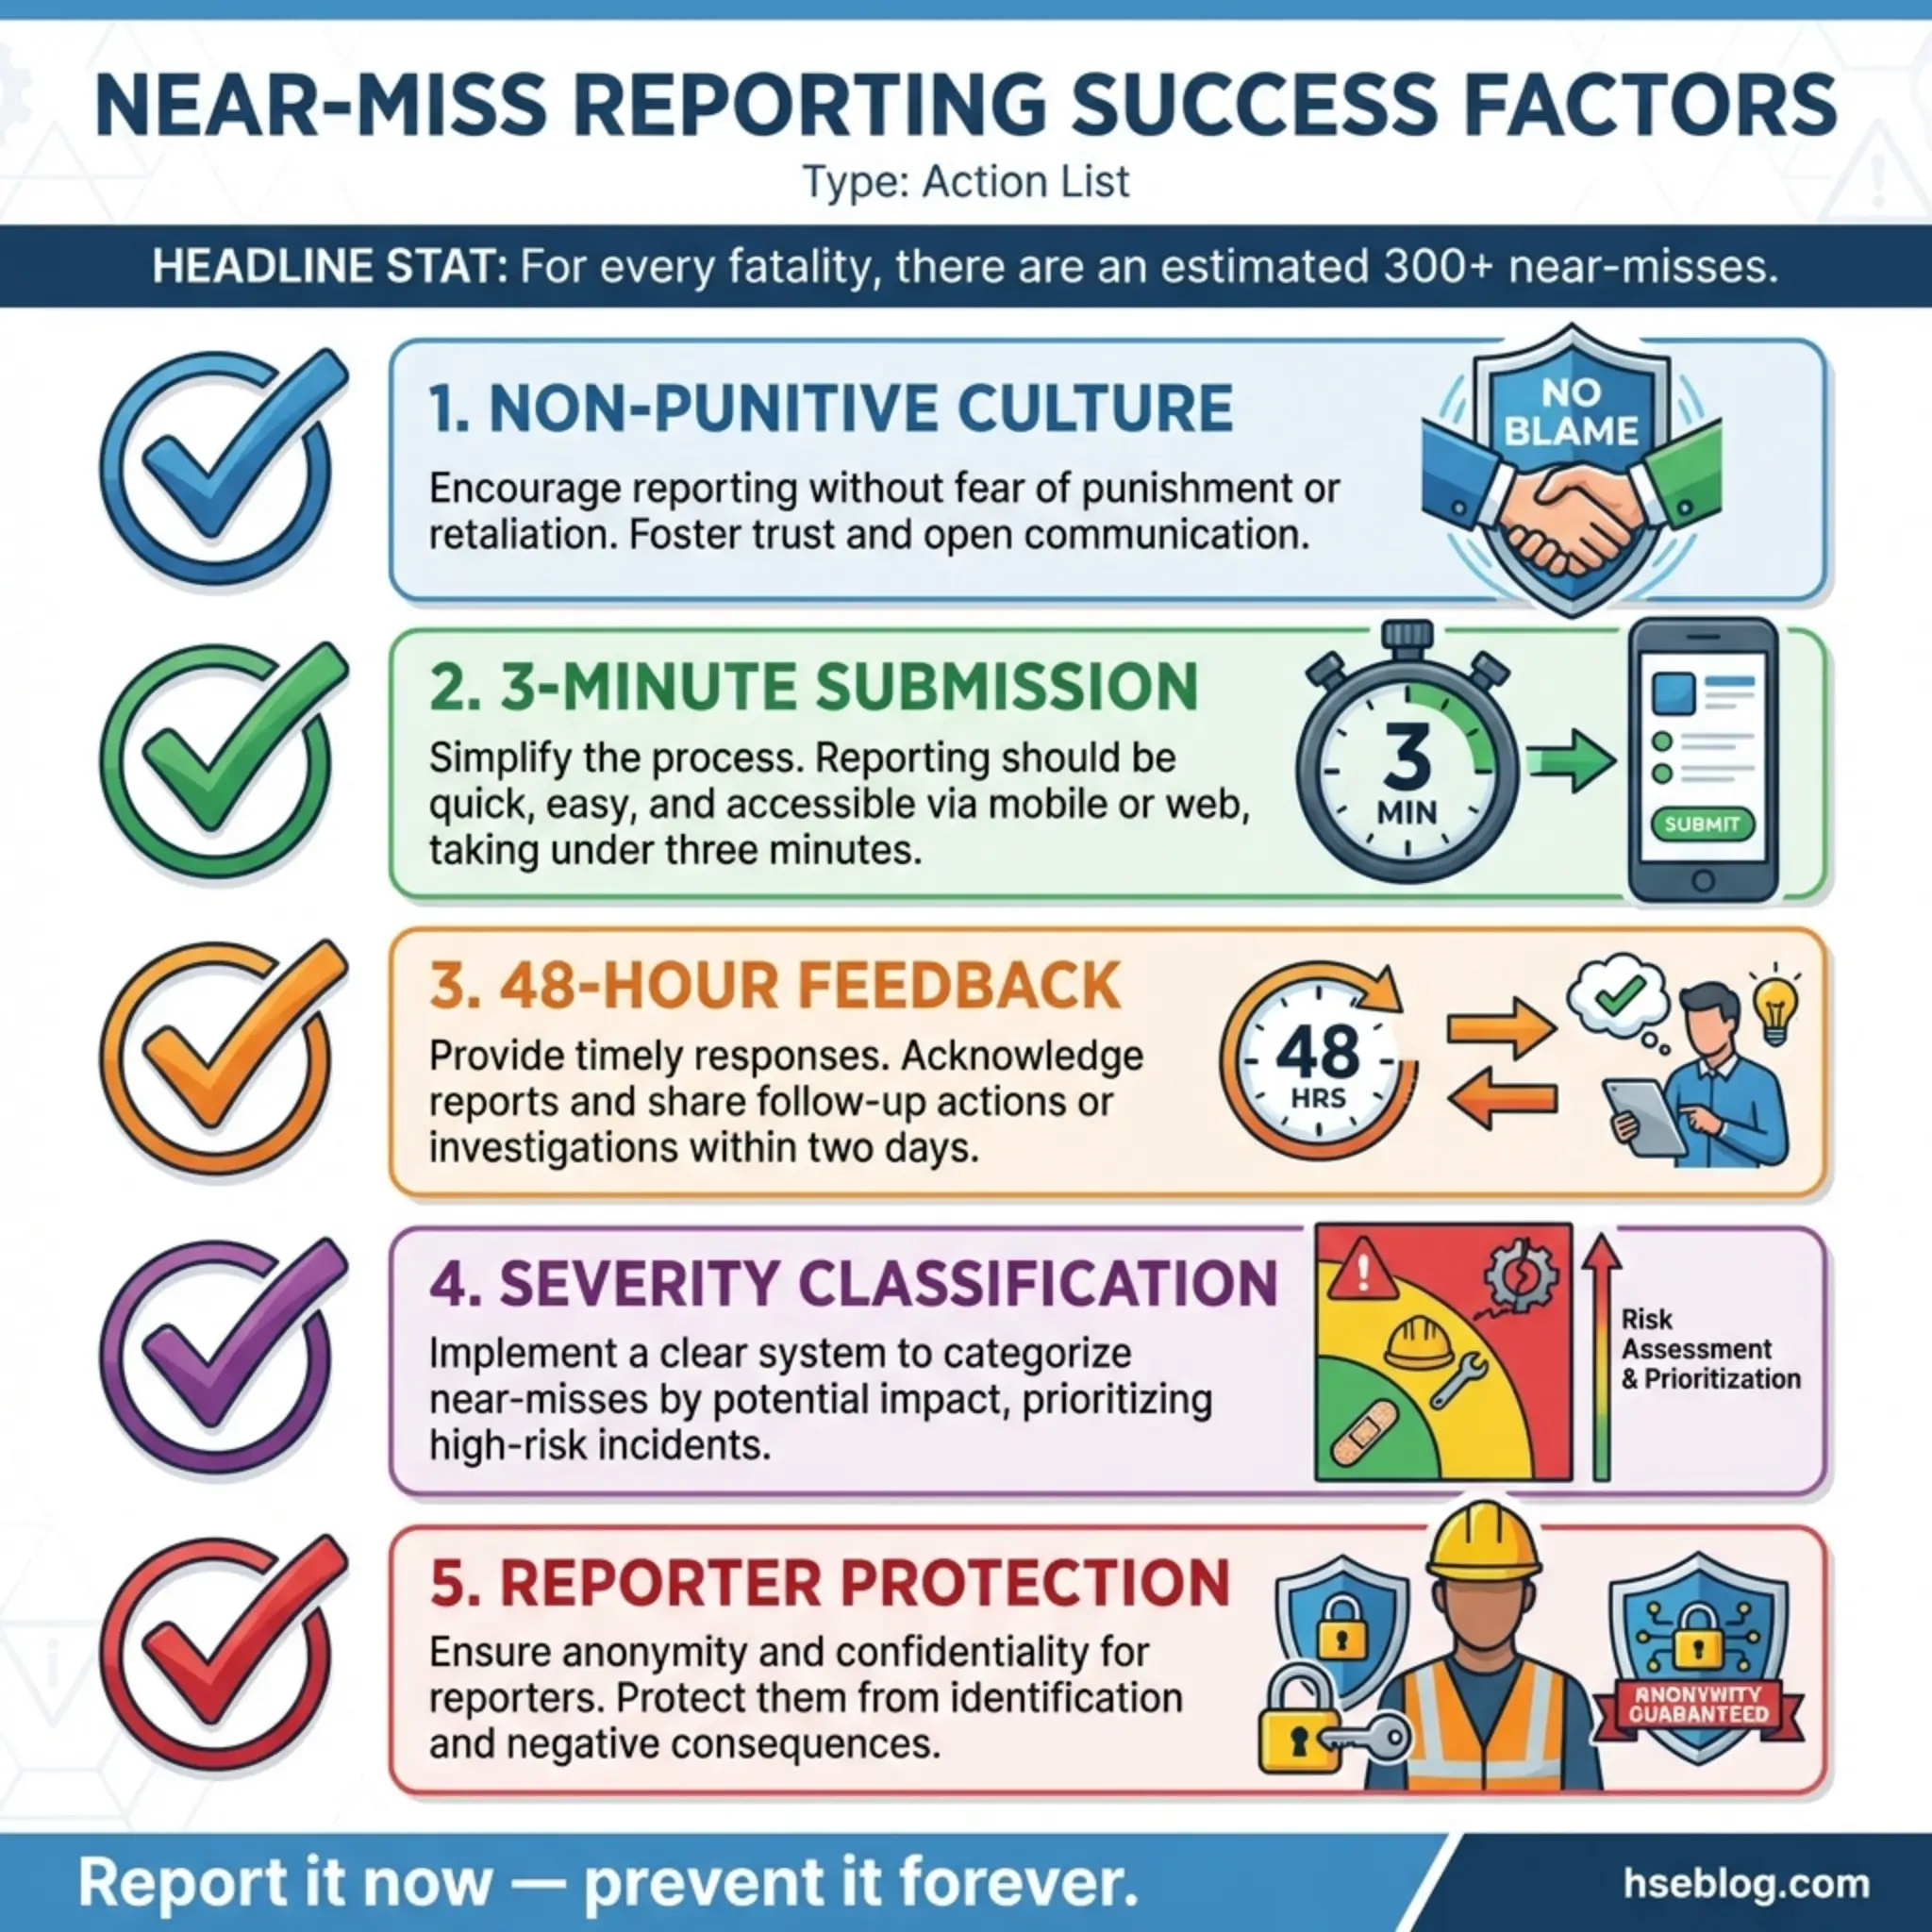
- Non-punitive culture: Workers must believe — through consistent action, not posters — that reporting a near-miss will never result in disciplinary action against the reporter.
- Simplicity of submission: If the form takes more than three minutes to complete, reporting rates collapse. Mobile apps, QR-code submissions, and verbal reports transcribed by supervisors all remove friction.
- Rapid feedback loops: When someone reports a near-miss, they need to see action within 48 hours — even if the action is temporary. Silence after reporting kills future participation.
- Classification and prioritization: Not every near-miss carries equal potential. High-potential near-misses — events that could have resulted in a fatality or permanent disability — must receive the same investigation rigor as actual serious injuries.
- Anonymity options with follow-up pathways: Some organizations allow anonymous reporting, but the most effective programs encourage named reporting with guaranteed protection.
3. First Aid Case Recording
First aid case recording sits just below OSHA recordable injuries in the severity hierarchy, but its value as a reactive monitoring method is frequently underestimated. These are the cuts, strains, minor burns, and eye irritations that receive on-site treatment but don’t require medical attention beyond first aid.
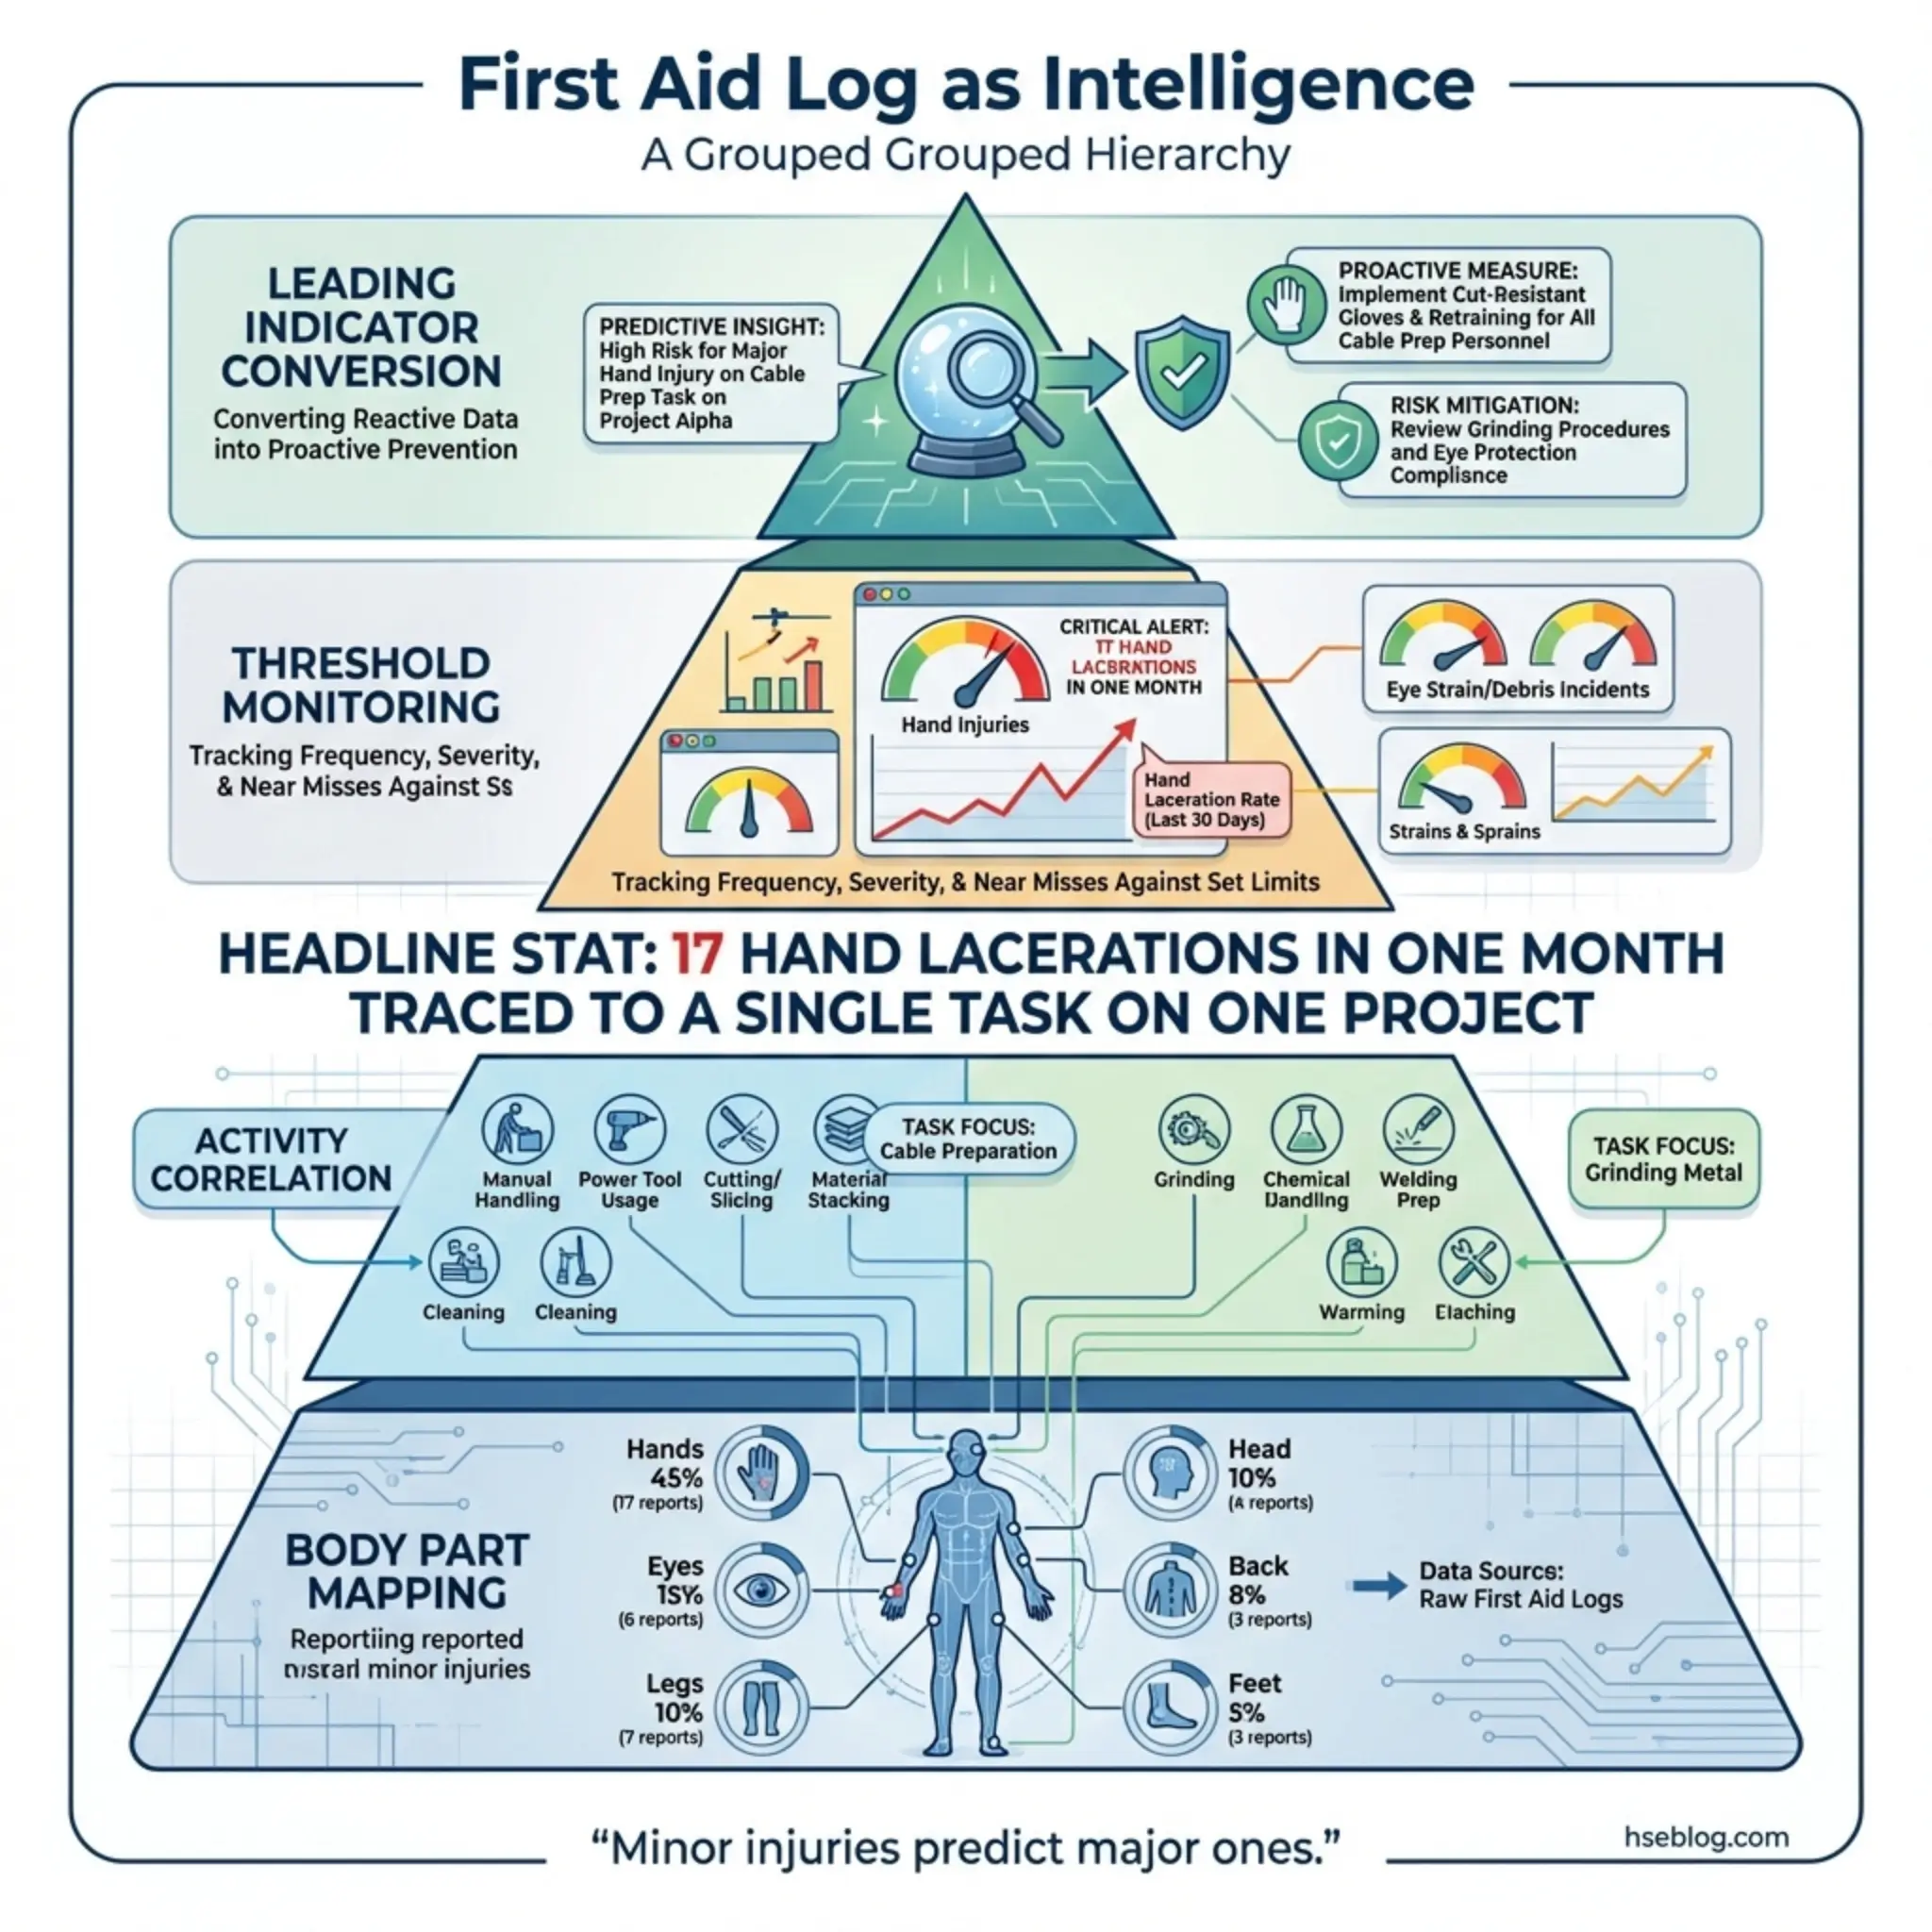
On a pipeline construction project in North Africa, I noticed the first aid log showed a concentration of hand lacerations — seventeen in a single month. Every one involved utility knife use during pipe wrapping operations. None individually triggered an investigation because none met the recordable threshold. But the pattern was screaming at anyone who bothered to look.
First aid data becomes a powerful reactive tool when organizations capture and analyze it systematically:
- Consistent recording standards: Every first aid treatment must be logged — not just the ones the supervisor notices. This requires trained first aiders who understand their documentation responsibility.
- Body part mapping: Tracking which body parts are injured most frequently reveals PPE gaps, ergonomic failures, and task-specific hazards that risk assessments may have missed.
- Activity correlation: Linking first aid cases to specific work tasks, equipment types, or work areas identifies concentration points that warrant control improvements.
- Threshold monitoring: Setting internal trigger points — for example, more than five similar first aid cases in a month — that automatically escalate the pattern to investigation status.
- Leading indicator conversion: First aid frequency rates can function as early-warning leading indicators of safety performance when tracked against operational activity levels.
Pro Tip: Treat your first aid log as a free intelligence report. The patterns hiding in minor injury data will tell you exactly where your next serious injury is most likely to occur — if you bother to read it.
4. Occupational Ill Health Reporting
Occupational ill health reporting monitors work-related diseases and health conditions caused or aggravated by workplace exposures. Unlike acute injuries, occupational illnesses often develop over months or years — noise-induced hearing loss, musculoskeletal disorders, respiratory disease from dust or chemical exposure, and dermatitis from solvent contact.
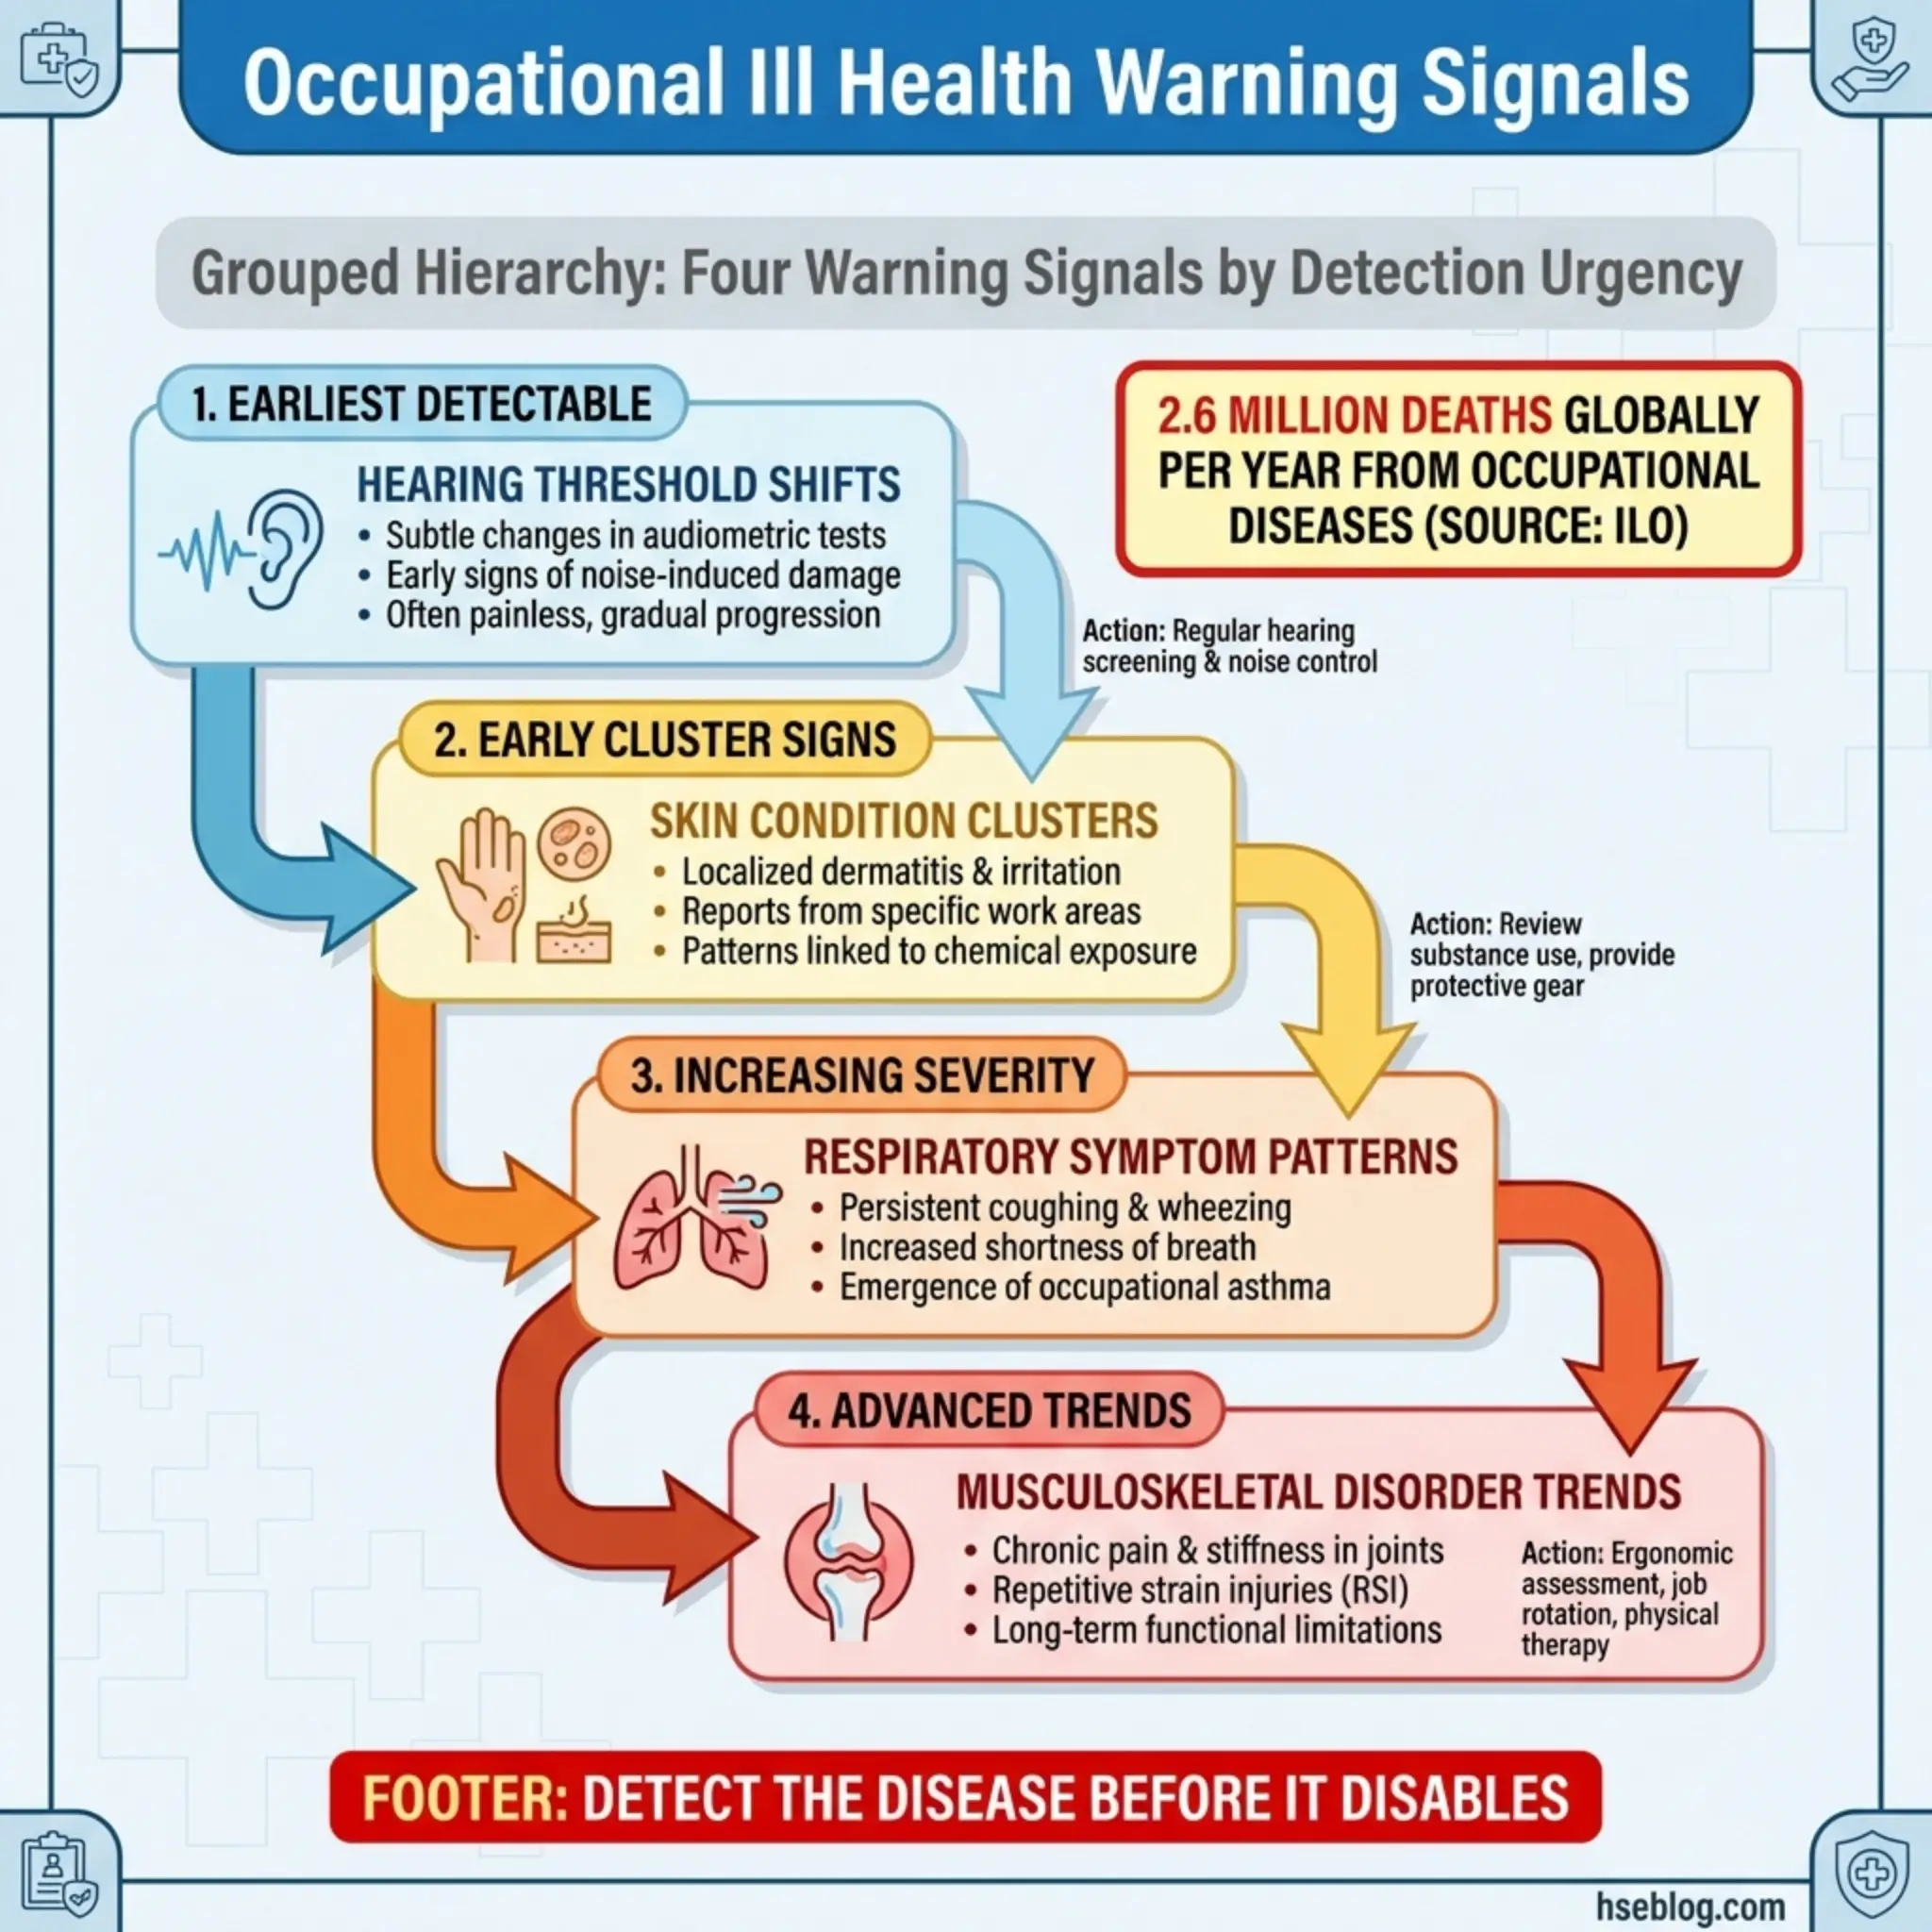
I recall an occupational health surveillance program at a chemical manufacturing facility in Southeast Asia where routine audiometry identified seven workers with early-stage hearing threshold shifts — all assigned to the same grinding operation. The noise assessment on file showed the area at 82 dB(A), below the action level. When I re-measured with a dosimeter over a full shift, the actual exposure was 91 dB(A). The original assessment had been conducted during a partial shutdown.
Occupational ill health monitoring requires specific mechanisms to be effective:
- Health surveillance programs: Baseline and periodic medical examinations targeted to the specific hazards workers are exposed to — audiometry for noise, spirometry for dust, skin checks for chemical contact.
- Occupational disease case reporting: Formal classification and reporting of confirmed occupational diseases to regulatory bodies where required (RIDDOR in the UK, OSHA 300 Log in the US).
- Exposure-outcome correlation: Linking diagnosed health conditions back to specific workplace exposures, job roles, and duration of exposure to establish causation.
- Long-latency disease tracking: Conditions like occupational cancers and chronic lung disease may appear decades after exposure. Records must be retained and accessible for extended periods.
- Trend monitoring across workforce populations: Comparing health outcomes across departments, job functions, and exposure groups to identify emerging clusters.
OSHA’s General Duty Clause (Section 5(a)(1)) and HSE UK’s COSHH Regulations both require employers to prevent or adequately control exposure to substances hazardous to health — making occupational ill health data a direct measure of whether that legal duty is being met.
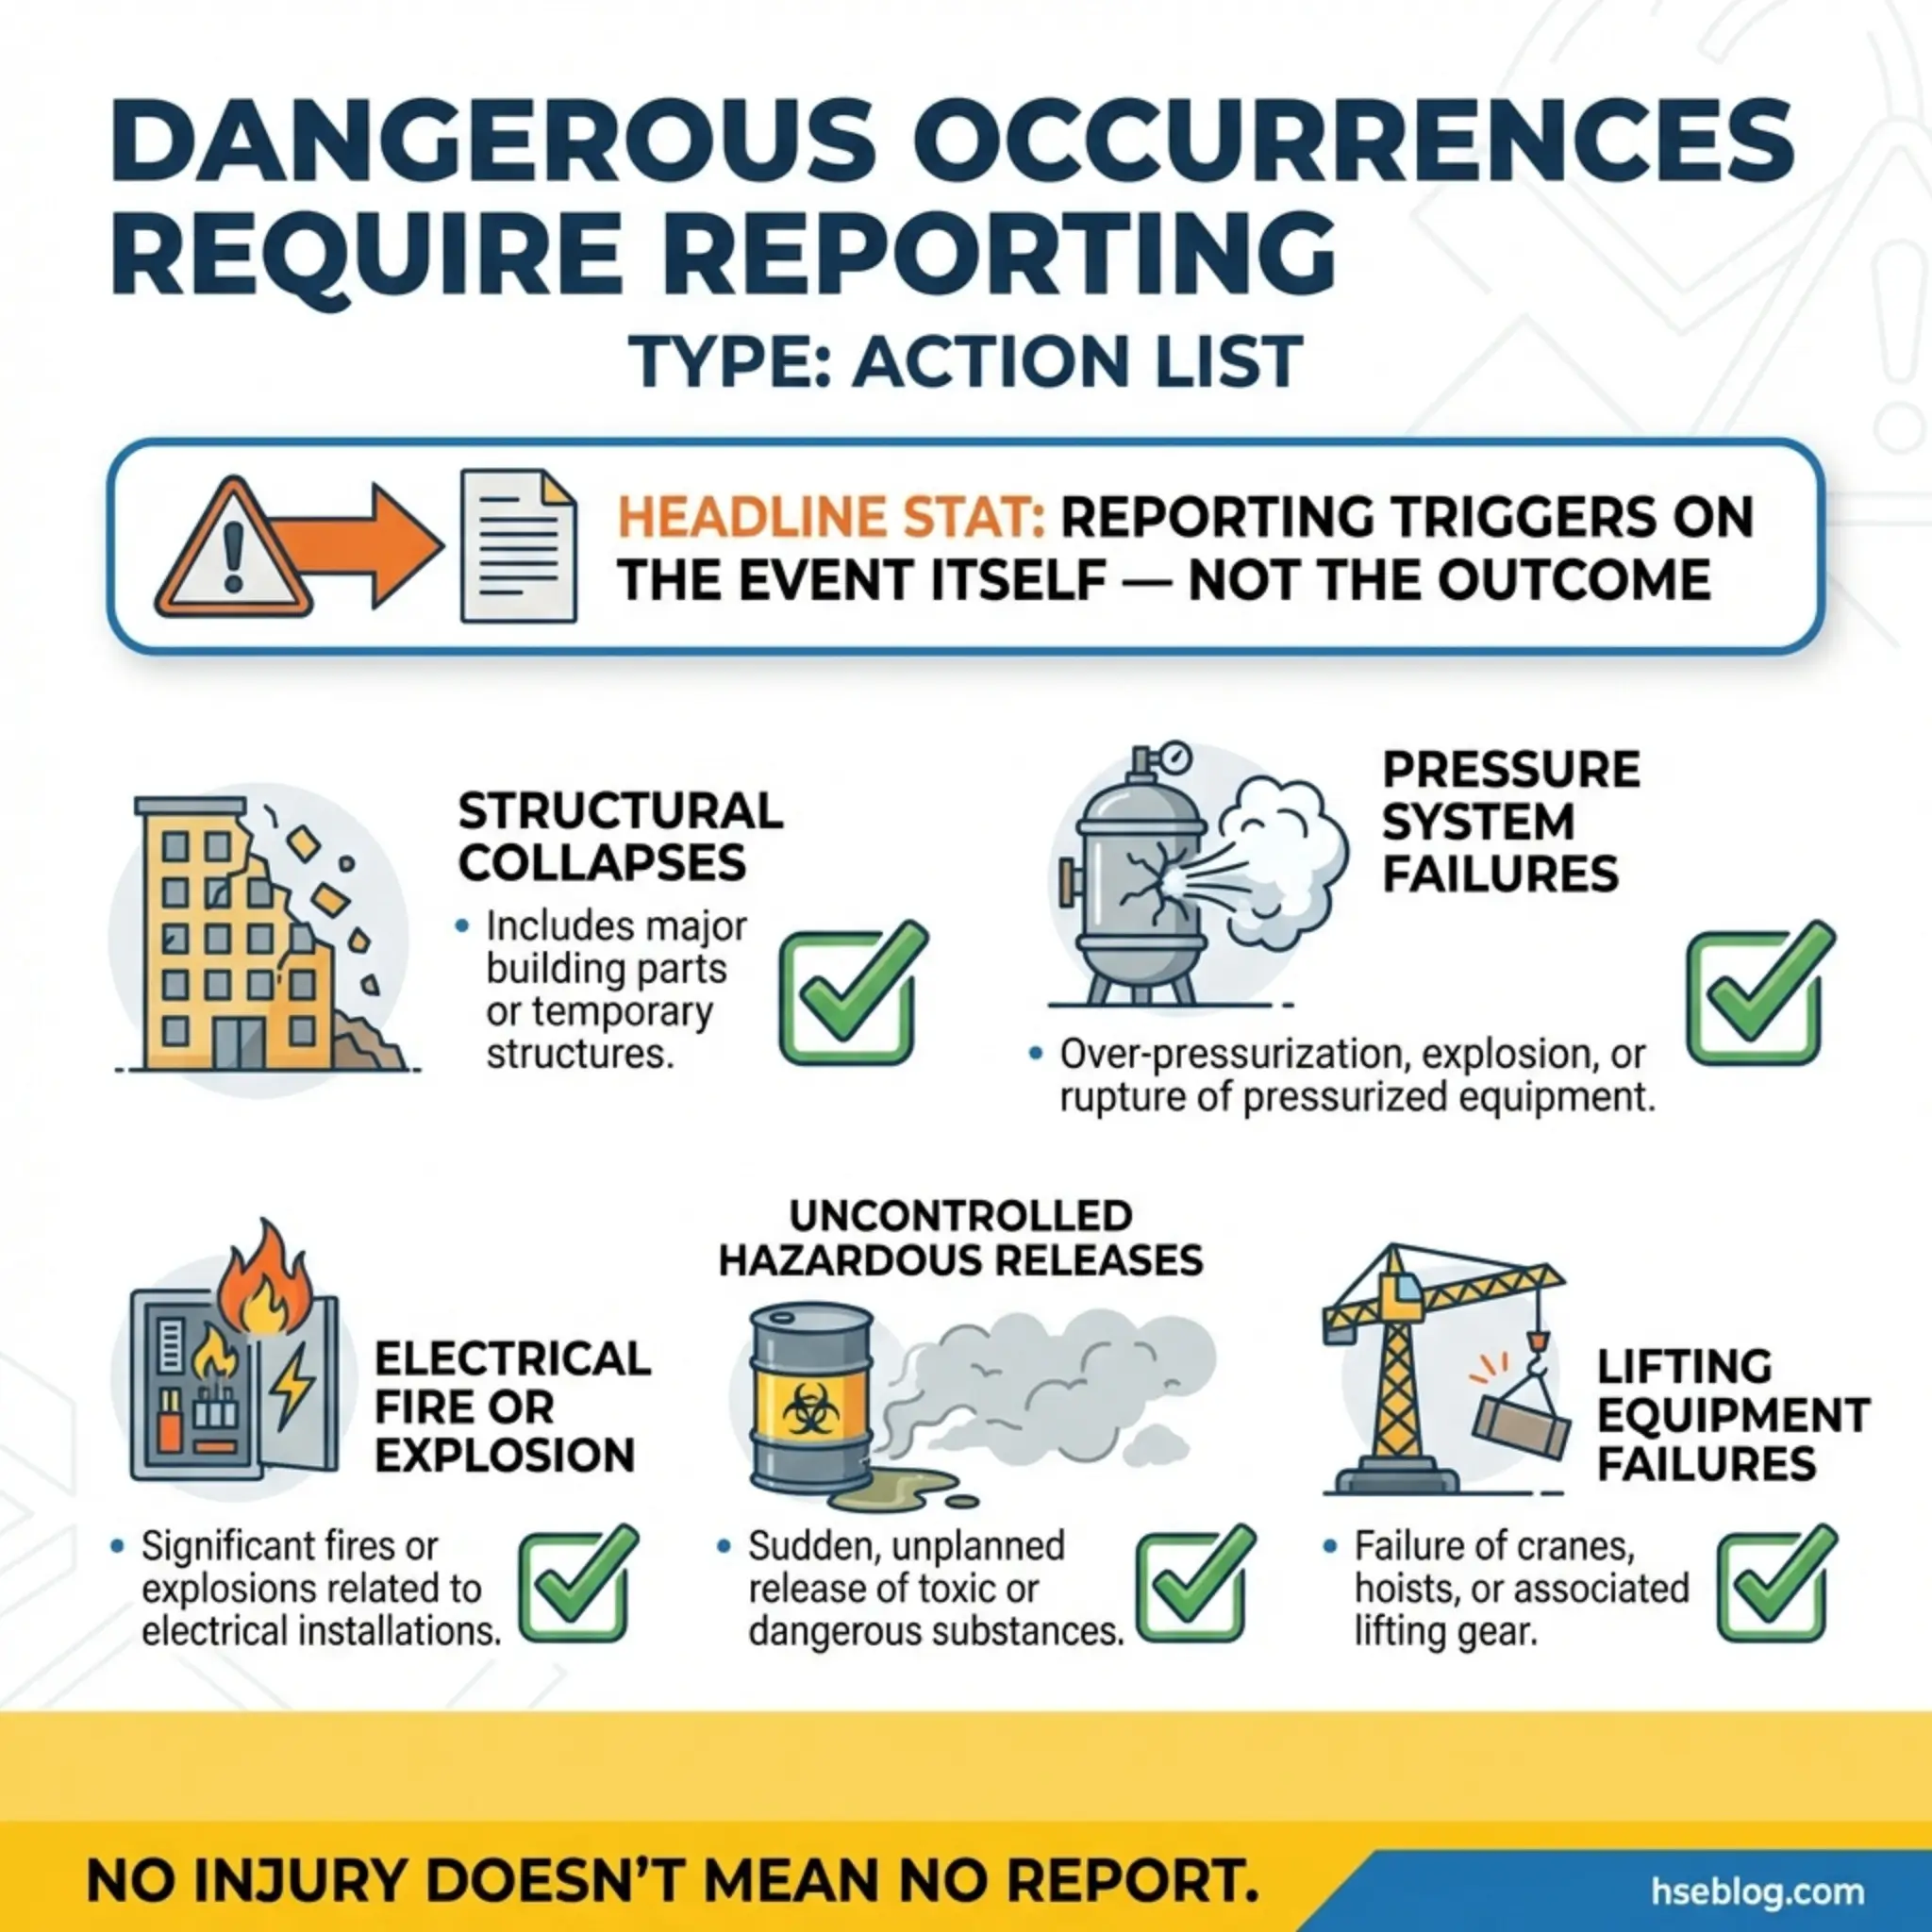
5. Dangerous Occurrence Reporting
Dangerous occurrences are specific categories of events that carry a high potential for serious harm — even if no injury actually resulted. They are distinct from general near-misses because they are legally defined and carry mandatory reporting obligations under most regulatory frameworks.
During a tank farm operation in the Gulf, a pressure relief valve failed to lift during a process upset. No one was injured, but the vessel exceeded its maximum allowable working pressure by fourteen percent before the operator manually depressurized. This qualified as a dangerous occurrence under both local and international standards, triggering mandatory regulatory notification within twenty-four hours.
Dangerous occurrences typically include specific event categories defined by regulation:
- Structural collapses: Scaffold failures, building collapses, excavation cave-ins, or crane structural failures — whether or not anyone is caught in the collapse.
- Pressure system failures: Bursting of pressure vessels, pipelines, or associated fittings, including relief valve malfunctions.
- Electrical incidents: Electrical short circuits or overloads attended by fire or explosion, or causing equipment damage.
- Uncontrolled releases: Escape of flammable, toxic, or corrosive substances in quantities that could cause harm to persons or the environment.
- Lifting equipment failures: Collapse, overturning, or failure of load-bearing components of cranes, hoists, lifts, or lifting accessories.
The reporting threshold for dangerous occurrences is the event itself — not the outcome. Whether ten people were nearby or the area was empty makes no difference to the reporting obligation. This is a common compliance gap I encounter during audits: site teams fail to report dangerous occurrences because “nobody got hurt.”
6. Property Damage Reporting
Property damage reporting tracks events where physical assets — equipment, structures, vehicles, infrastructure, or materials — are damaged or destroyed, regardless of whether anyone was injured. Many organizations undervalue this reactive monitoring method because it lacks the emotional weight of human injury data.
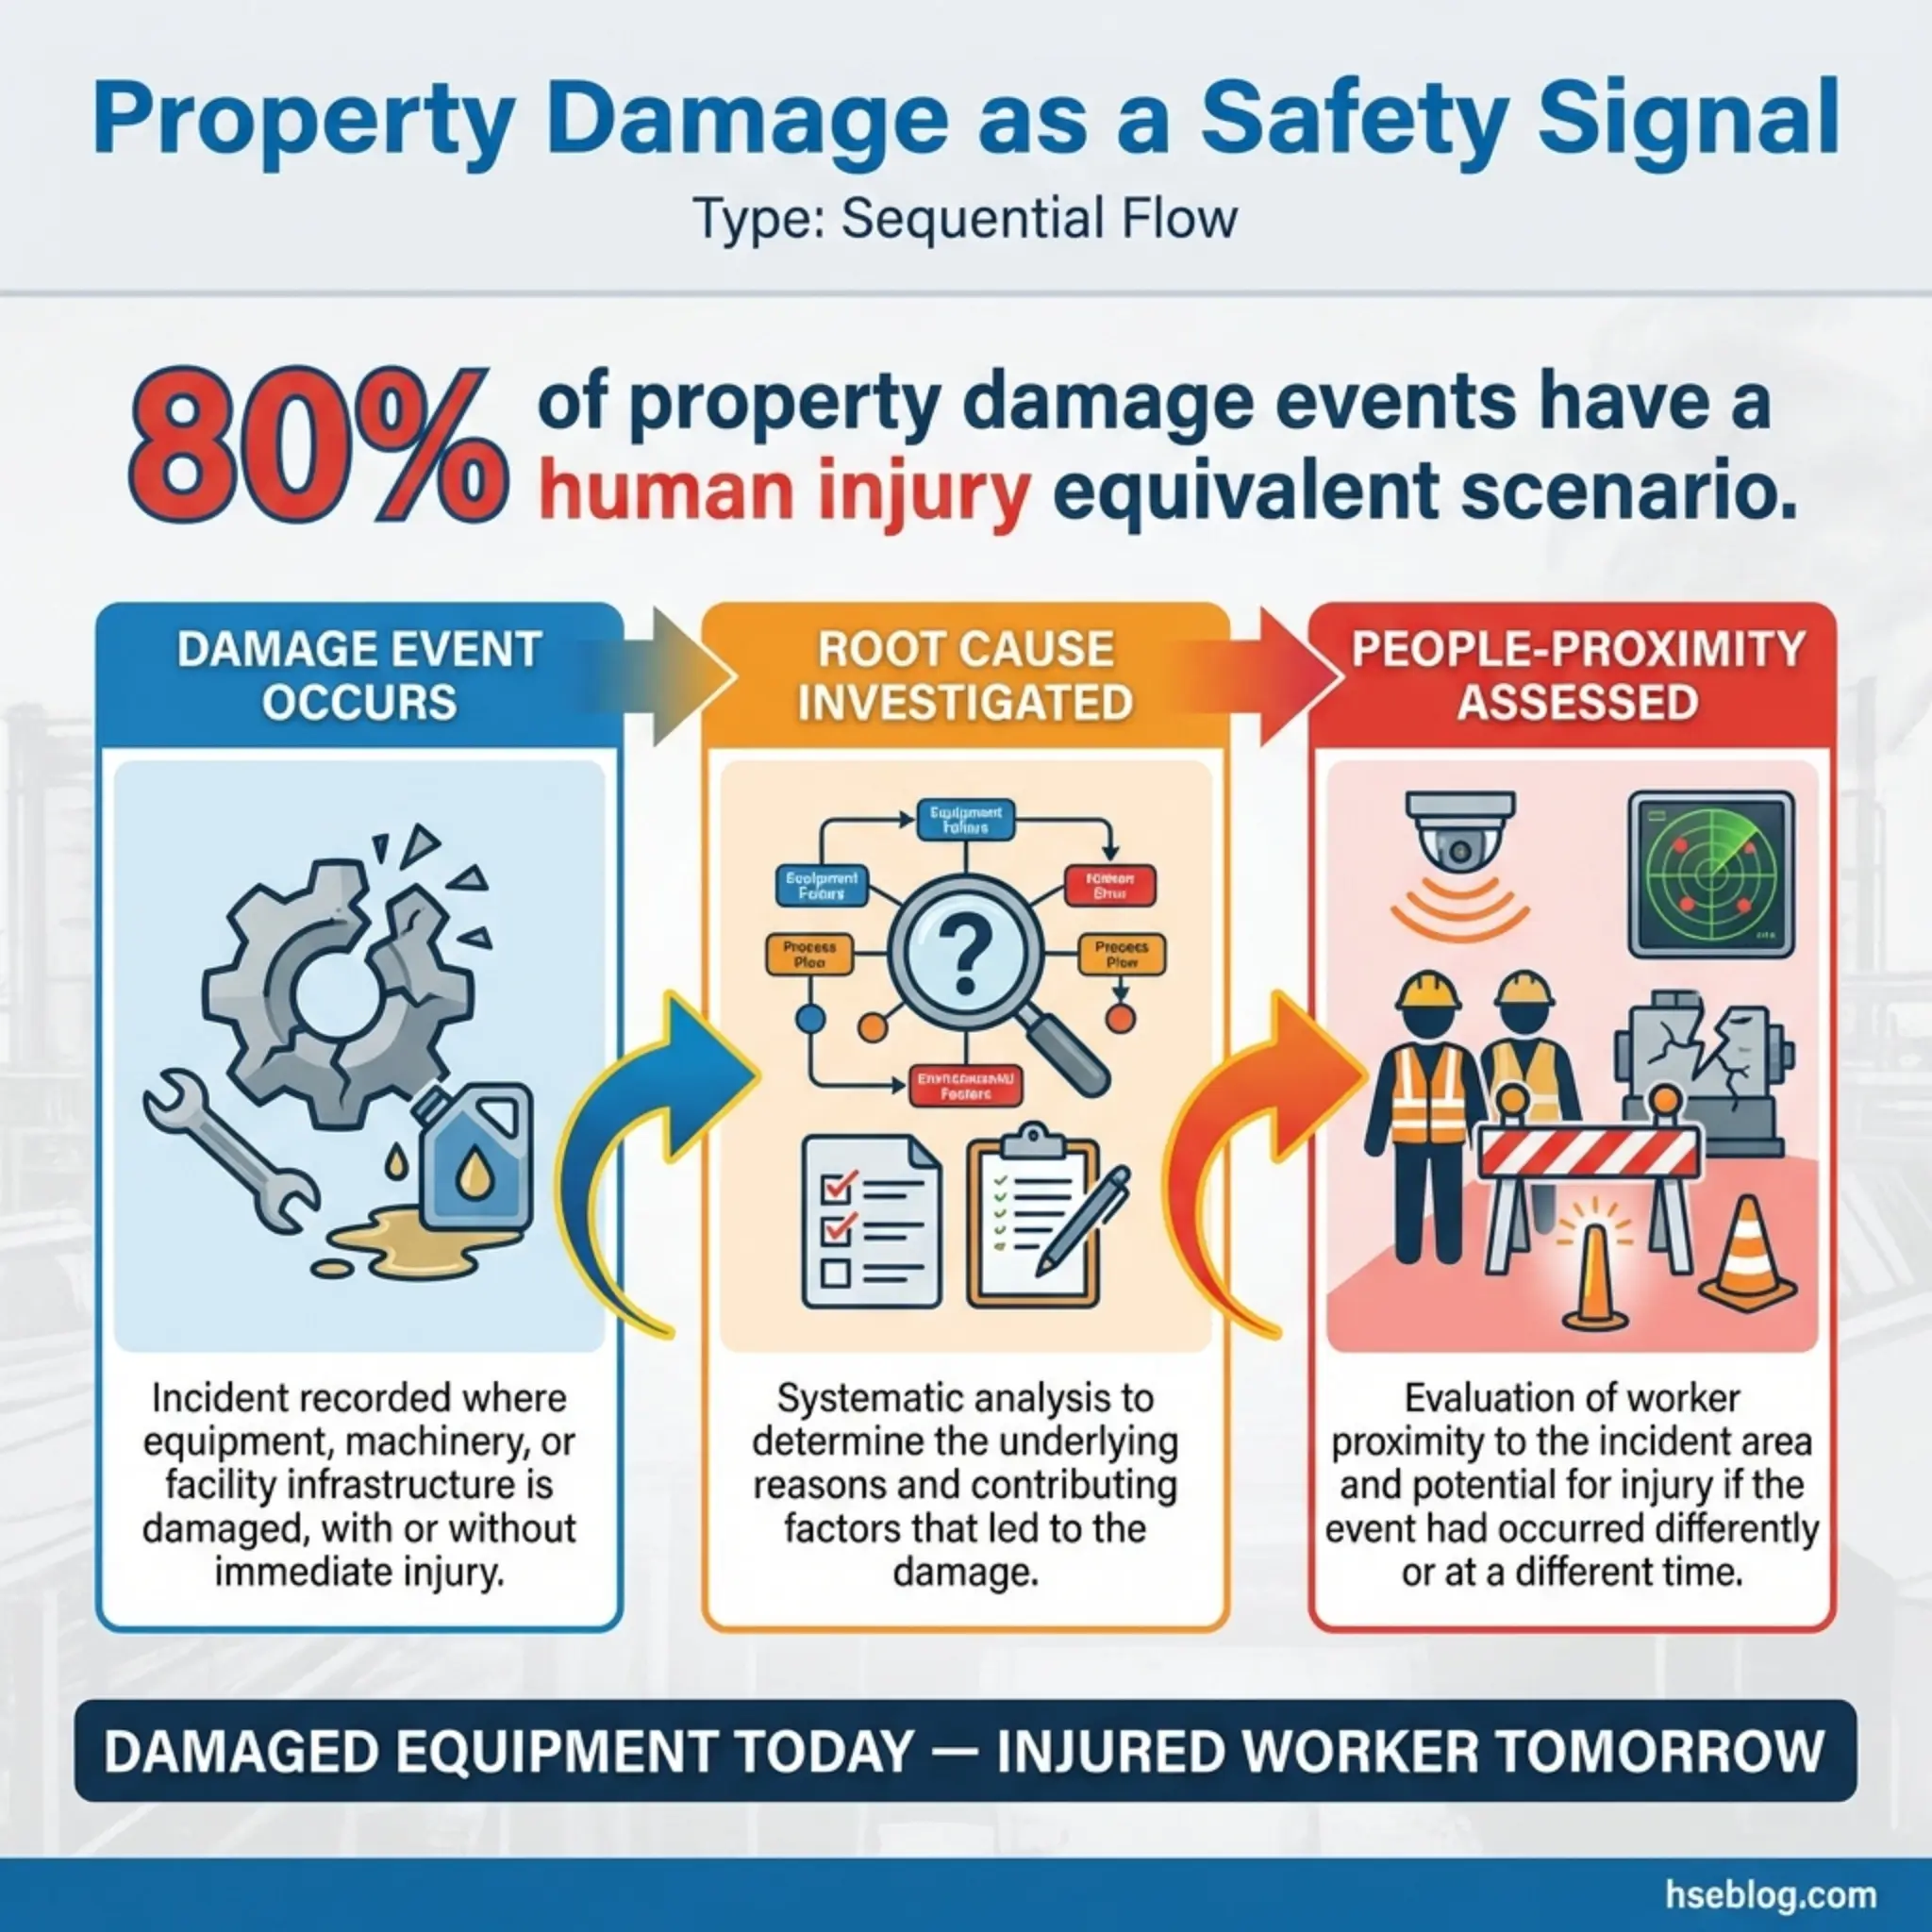
On a mining operation in Western Australia, I reviewed property damage data spanning eighteen months. The haul truck fleet showed a pattern of tire blowouts concentrated on a specific haul road section. Each blowout was costed, repaired, and filed. Nobody had connected the dots to realize that the road surface degradation in that section was also the likely cause of two rollover near-misses. The property damage data held the prevention clue that the near-miss reports had missed.
Property damage monitoring delivers its best value through these practices:
- Standardized cost thresholds: Defining reporting categories by damage value — minor (under $1,000), moderate ($1,000–$10,000), major (above $10,000) — to prioritize investigation effort.
- Root cause investigation for major damage: Applying the same investigation methodology used for personal injuries to significant property damage events.
- Equipment and location tracking: Recording which equipment types and site locations generate the most damage events, revealing design flaws, training gaps, or environmental factors.
- Near-miss equivalence analysis: Assessing every property damage event for its “people proximity” — how close were workers to the damage zone, and what would the outcome have been if someone had been present?
- Financial trend reporting to management: Presenting property damage costs in financial terms that resonate with directors and project managers who may not respond to safety-only arguments.
7. Environmental Incident Reporting
Environmental incident reporting captures events where workplace activities cause or threaten harm to the natural environment — spills, emissions breaches, unauthorized discharges, waste management failures, and contamination events. This is one of the reactive monitoring methods most frequently siloed away from safety departments, creating dangerous gaps in organizational learning.
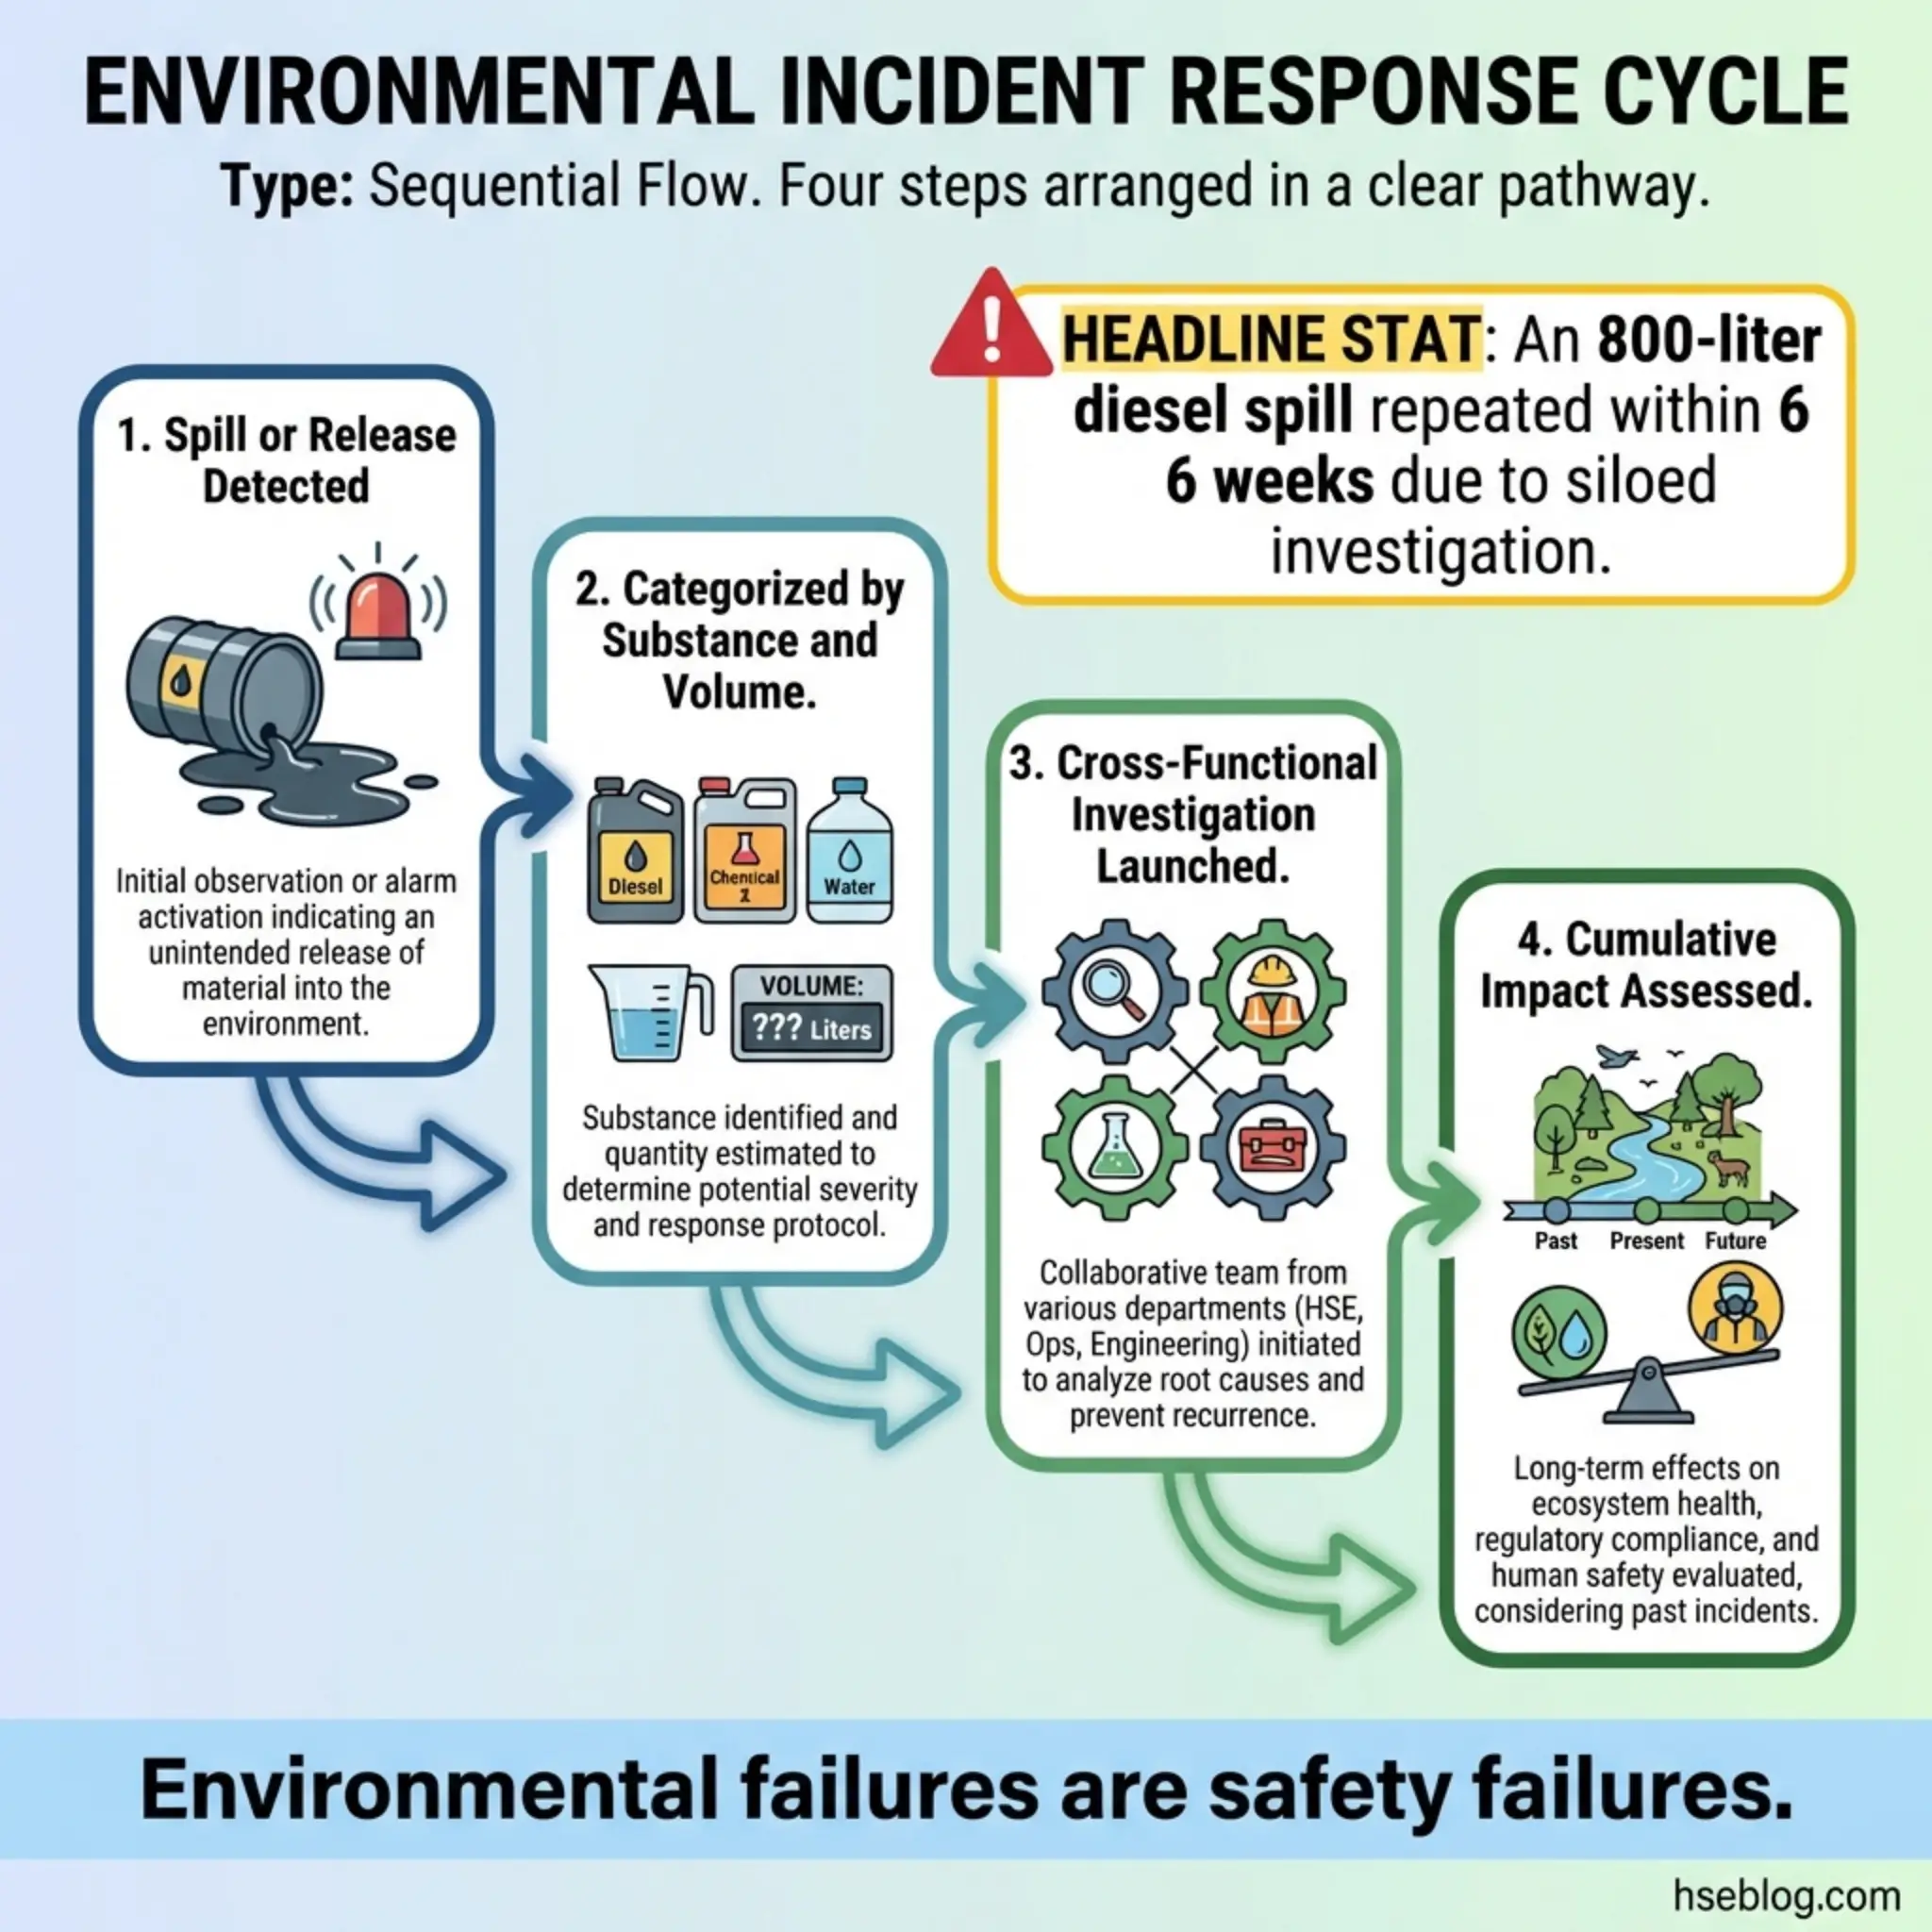
I investigated a diesel fuel spill at a construction site in Northern Europe where 800 liters entered a storm drain connected to a local waterway. The environmental team managed the cleanup and regulatory notification. The safety team never saw the report. Six weeks later, a nearly identical spill occurred on the same site because the root cause — a damaged flexible hose connector used without inspection — was a procurement and maintenance issue that the environmental team’s corrective actions hadn’t addressed from a site-wide perspective.
Effective environmental incident monitoring integrates with the broader safety management system through these mechanisms:
- Spill and release categorization: Classifying events by substance type, volume, receptor sensitivity, and regulatory reporting threshold.
- Regulatory notification compliance: Meeting mandatory notification timelines — which vary significantly between jurisdictions — for reportable environmental incidents.
- Cross-functional investigation: Ensuring environmental incidents receive root cause investigation that includes operational, maintenance, and safety perspectives, not just environmental compliance review.
- Environmental monitoring data review: Tracking ambient air quality, water quality, noise monitoring, and soil sampling results against permit conditions and action thresholds.
- Cumulative impact assessment: Monitoring whether repeated small-scale environmental incidents indicate a systemic control failure rather than isolated events.
8. Complaints and Feedback Monitoring
Complaints from workers, contractors, neighbors, regulators, clients, or the public function as a reactive monitoring method that captures dissatisfaction signals related to health, safety, and environmental performance. This method is routinely overlooked because complaints are often treated as customer service issues rather than safety intelligence.
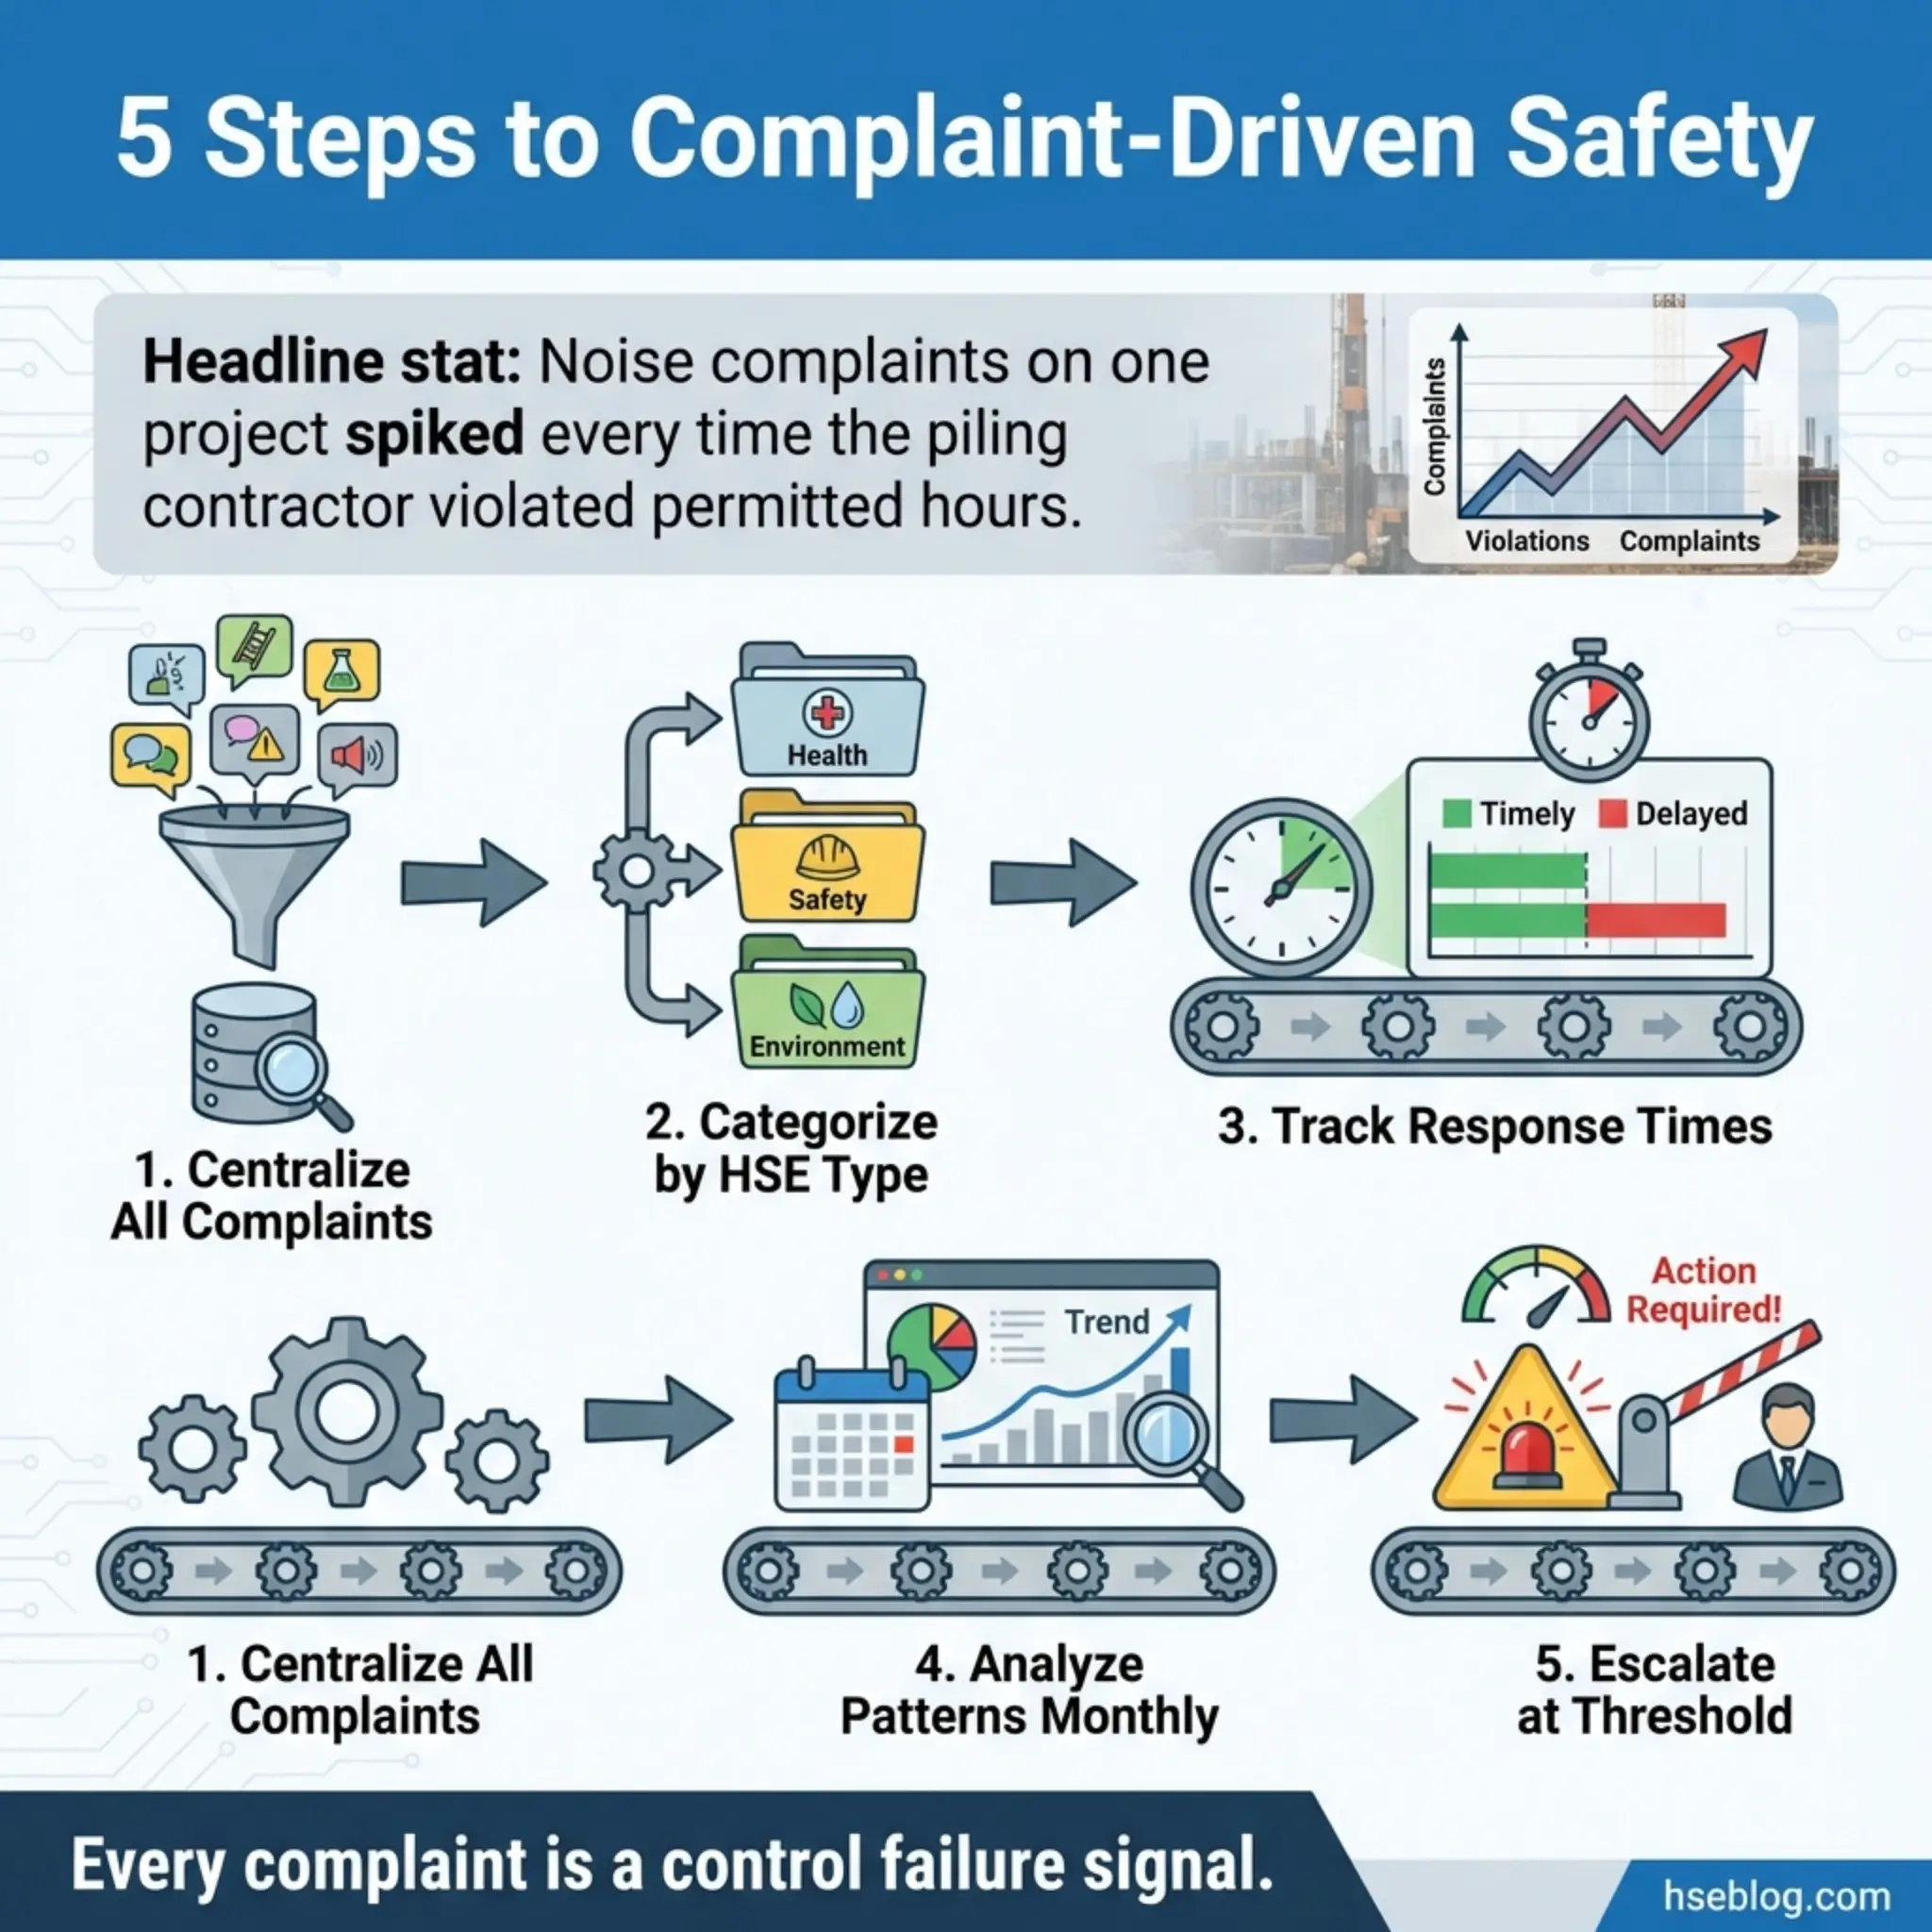
On a residential construction project adjacent to an occupied neighborhood, the site received multiple noise complaints over a three-week period. The project team treated each complaint individually — apologizing, adjusting work hours slightly, and filing the correspondence. Nobody aggregated the data. When I reviewed the complaint log during a quarterly audit, the pattern showed that complaints spiked every time piling operations resumed — and the piling contractor was operating outside the permitted hours specified in the environmental management plan. The complaints were the monitoring system working. The organization just wasn’t listening.
Complaint monitoring works best when structured around these principles:
- Centralized logging: All complaints, regardless of source or channel, must feed into a single register with date, nature, source, and response fields.
- Categorization by HSE relevance: Separating health, safety, and environmental complaints from general operational complaints allows targeted analysis.
- Response time tracking: Measuring how quickly complaints receive acknowledgment and resolution — both as a performance metric and a regulatory compliance measure.
- Pattern analysis: Reviewing complaint frequency by type, location, and time period to identify recurring issues that indicate control failures.
- Escalation triggers: Defining thresholds where complaint volume or severity automatically triggers a formal investigation or management review.
9. Insurance Claims Analysis
Insurance claims data provides a financial mirror of an organization’s reactive safety performance. Workers’ compensation claims, liability claims, property damage claims, and environmental liability claims all contain detailed information about the nature, cause, and cost of adverse events — information that is often more complete than internal safety reports because the financial stakes drive thorough documentation.
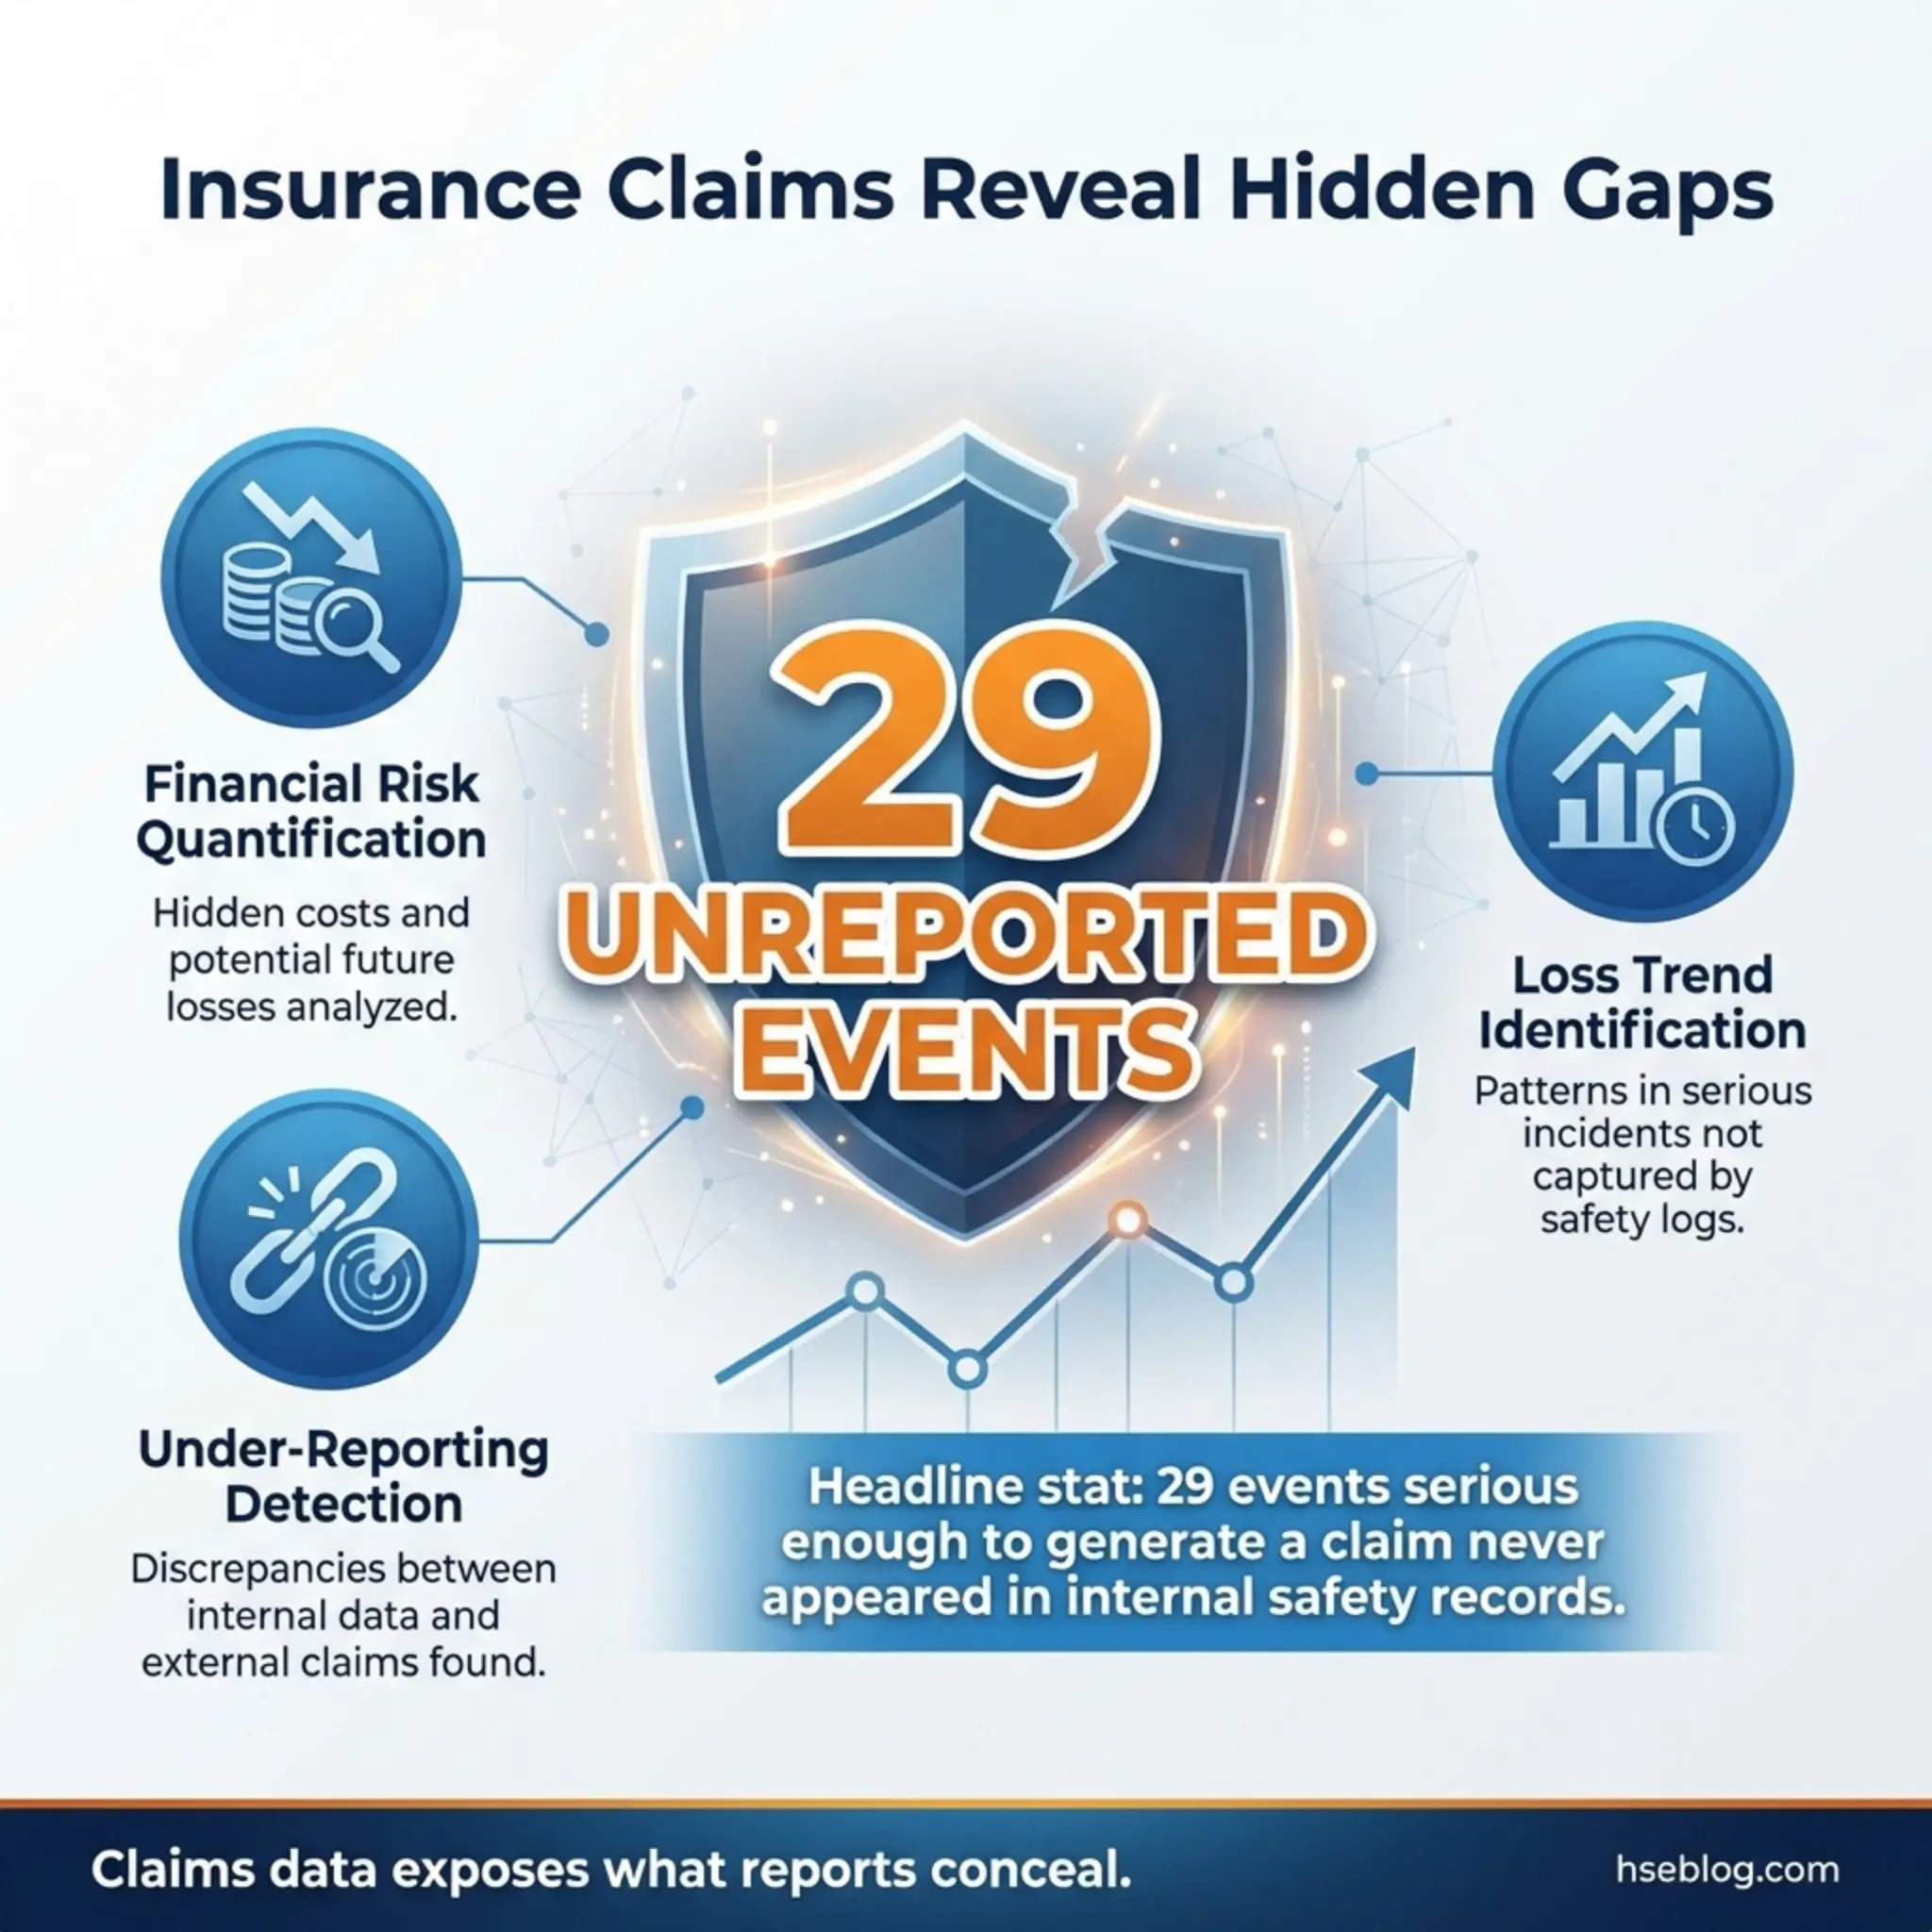
During a management system review for a logistics company operating across multiple depots, I requested their insurance claims data alongside their internal incident data. The gap was staggering. Internal records showed forty-two incidents over two years. Insurance claims data for the same period showed seventy-one — meaning twenty-nine events serious enough to generate a claim had never appeared in the safety reporting system.
Insurance claims analysis offers unique reactive monitoring advantages:
- Financial quantification of risk: Every claim attaches a cost to a failure, which translates safety performance into the language that boards and investors understand.
- Under-reporting detection: Comparing claims data against internal incident records reveals the reporting gap — the percentage of real events that the internal system misses.
- Loss trend identification: Multi-year claims data exposes trending hazards, high-risk operations, and seasonal patterns that single-year snapshots cannot reveal.
- Benchmarking against industry peers: Insurance data allows comparison of loss rates against industry averages, identifying where performance falls below sector norms.
- Cost-benefit justification for controls: Using actual claims costs to justify investment in specific control measures provides the financial evidence that risk assessments alone often lack.
10. Enforcement Action Tracking
Enforcement actions — improvement notices, prohibition notices, fines, prosecutions, and formal cautions issued by regulatory authorities — represent the most severe form of external reactive monitoring feedback. Each enforcement action means an independent authority has assessed your operation and found it non-compliant with legal standards.
I have sat in meetings where senior managers dismissed improvement notices as “inspectors being overly cautious” or “a difference of interpretation.” That dismissiveness evaporates quickly when the next visit results in a prohibition notice that shuts down a critical operation for three weeks. Every enforcement action carries a message, and the organization’s response determines whether that message becomes a learning event or a precursor to prosecution.
Tracking enforcement actions as a reactive monitoring method requires more than filing the paperwork:
- Centralized enforcement register: Every regulatory action — verbal warnings, written notices, improvement notices, prohibition notices, prosecutions — logged with dates, requirements, deadlines, and completion status.
- Root cause investigation: Treating each enforcement action as a system failure that warrants the same investigation rigor as a serious injury, not just a compliance correction.
- Systemic gap analysis: Assessing whether the non-compliance identified is isolated or symptomatic of a broader management system failure — a single missing guard versus a broken maintenance program.
- Regulatory relationship tracking: Monitoring the frequency, tone, and focus areas of regulatory interactions to identify emerging enforcement trends that may affect future operations.
- Board-level reporting: Escalating enforcement actions to senior leadership and governance bodies as material safety performance indicators.
Under the UK’s Health and Safety at Work etc. Act 1974, failure to comply with an improvement notice is a criminal offense carrying a potential fine and imprisonment. OSHA’s penalty structure similarly escalates for repeated or willful violations.
11. Absenteeism and Sickness Monitoring
Absenteeism monitoring tracks patterns in worker absence due to illness, injury, or unexplained reasons. While not traditionally classified alongside accident reporting, sickness absence data is a powerful reactive monitoring method because it captures health outcomes that formal injury and illness reporting systems frequently miss.
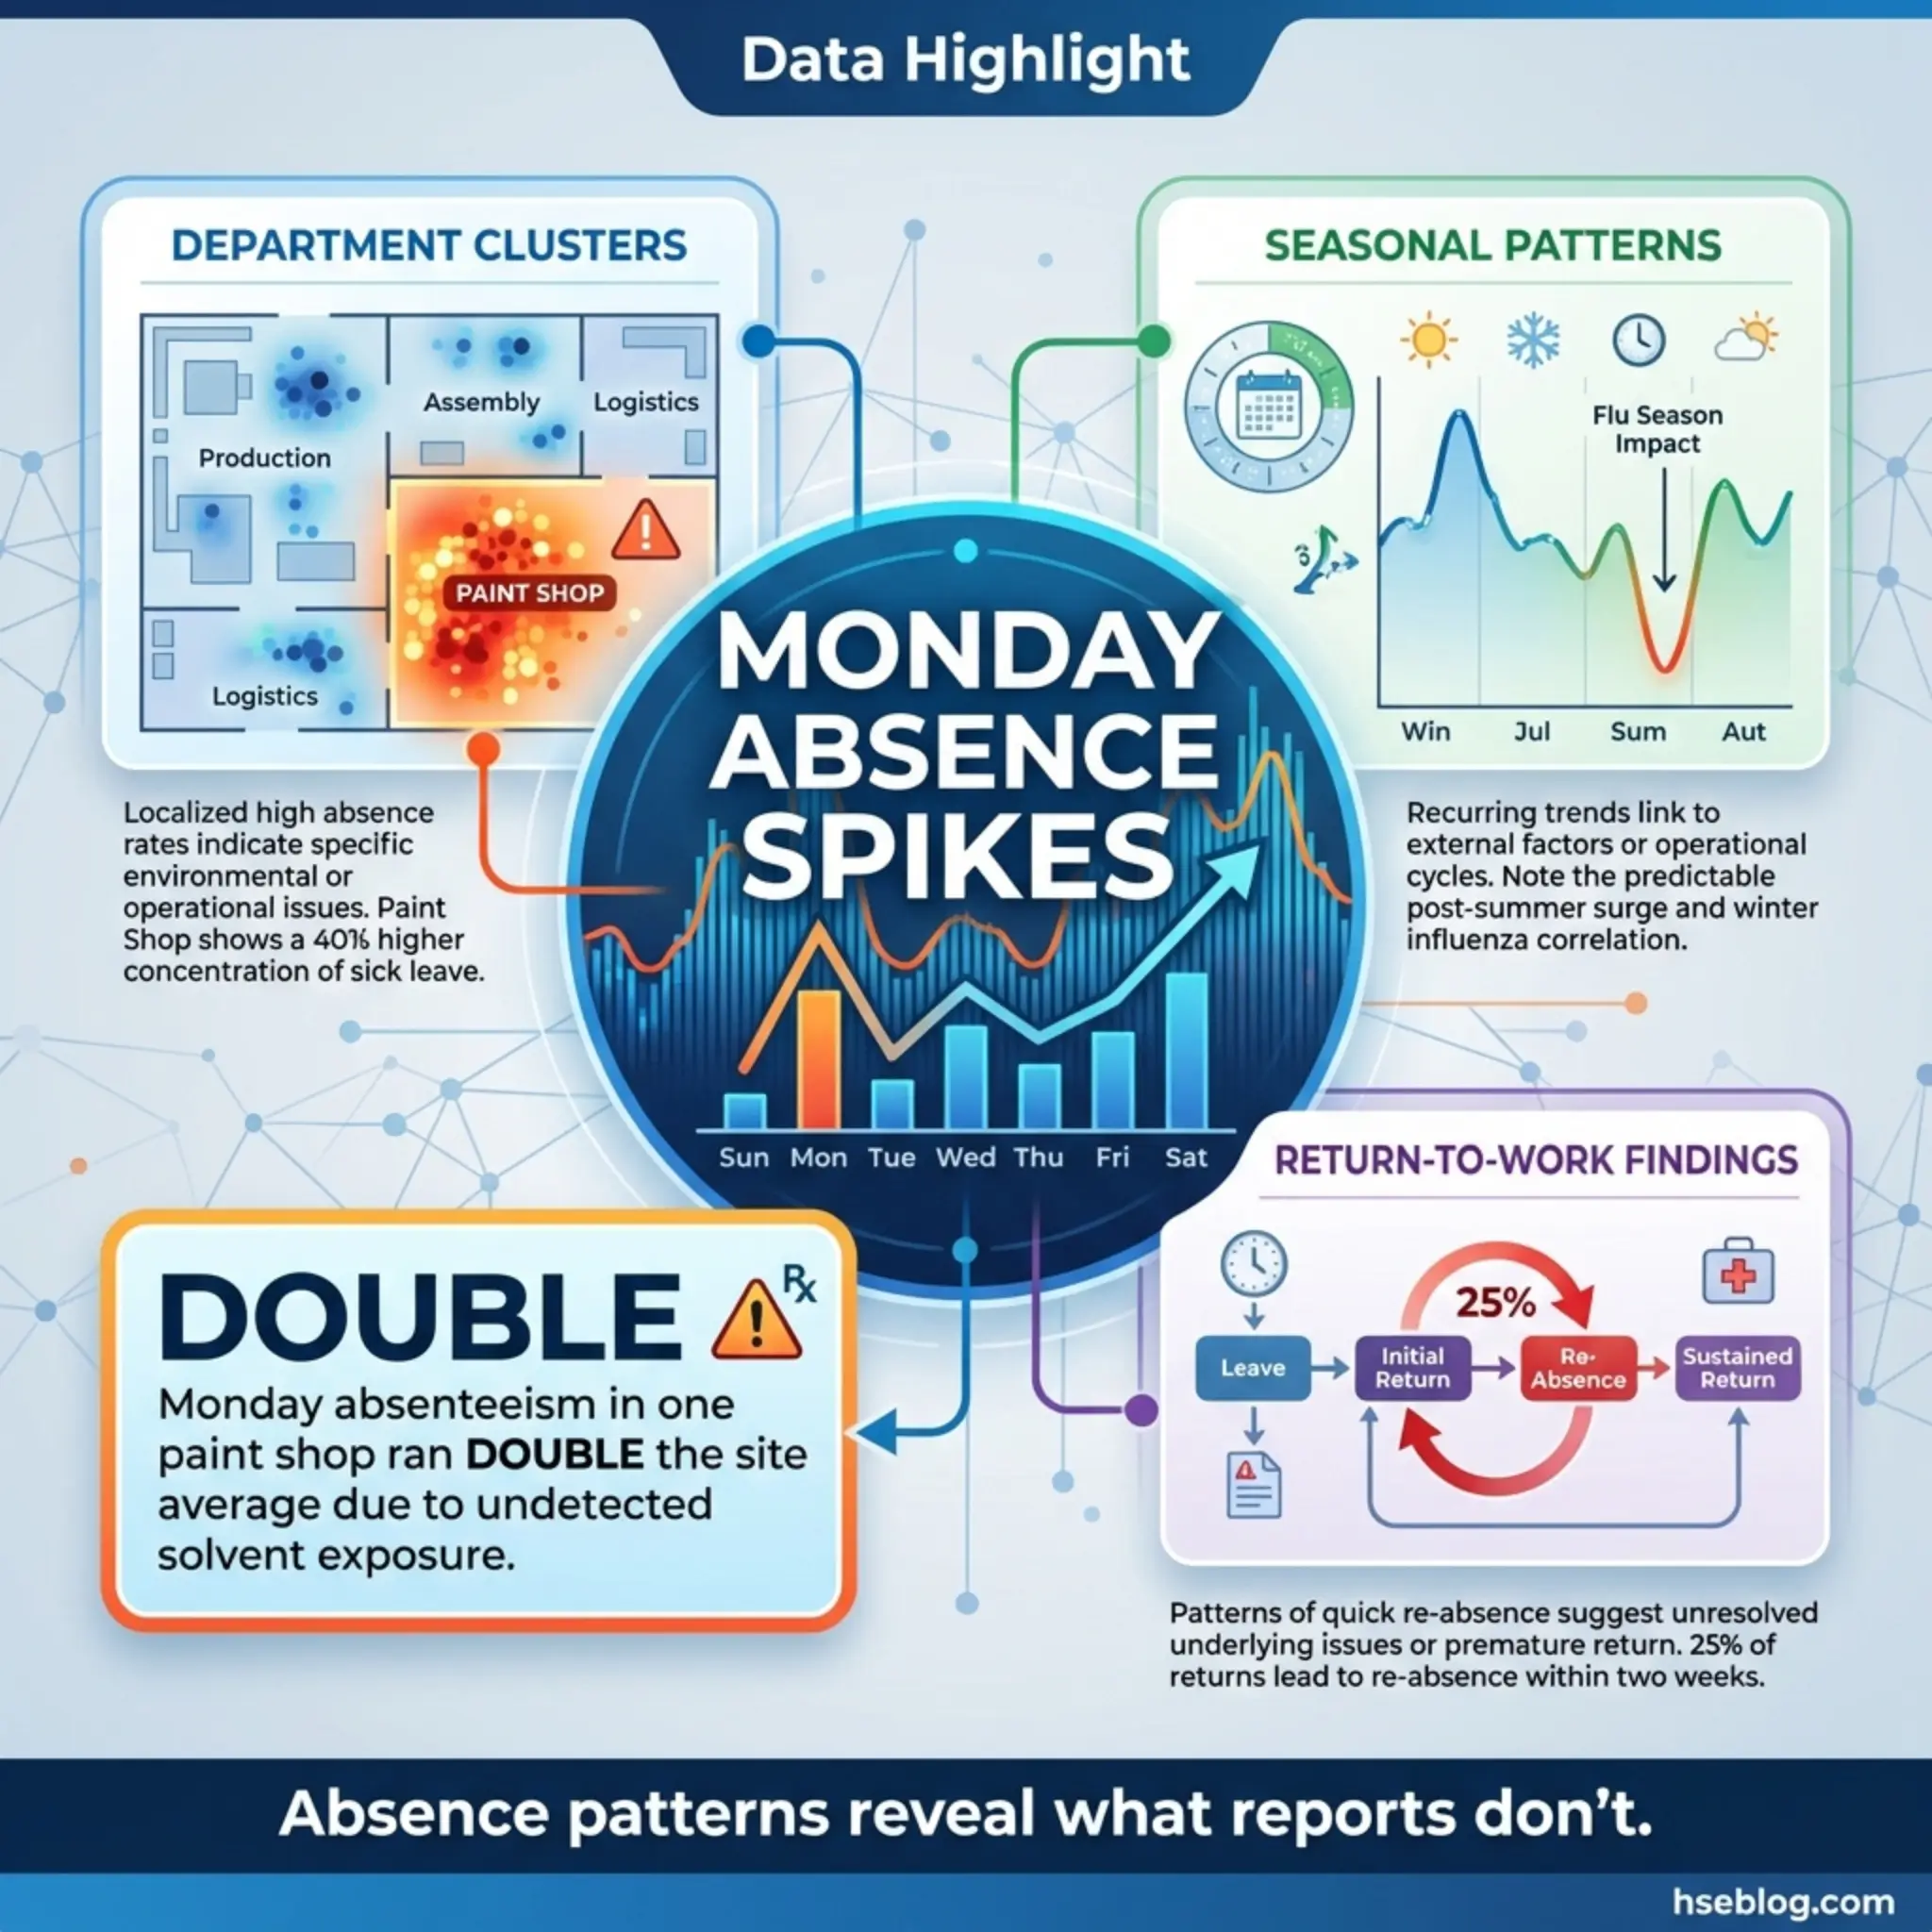
On a manufacturing site in Southeast Asia, I noticed that Monday absenteeism rates in the paint shop were consistently double the site average. The formal occupational health records showed no issues. When we investigated, workers were experiencing solvent-related headaches and nausea over the weekend after Friday exposure peaks — but none reported symptoms formally because the effects resolved by Tuesday. The absenteeism data caught what the occupational health system had missed.
Sickness absence monitoring contributes to reactive monitoring through these approaches:
- Department and role-specific tracking: Comparing absence rates across different work areas, job functions, and exposure groups to identify clusters that suggest occupational causation.
- Seasonal and temporal pattern analysis: Identifying spikes in absence that correlate with specific operational activities, weather conditions, or exposure periods.
- Return-to-work interview data: Using structured return-to-work conversations to capture information about whether the absence was work-related — information that workers may not volunteer through formal reporting channels.
- Long-term absence tracking: Monitoring cases where short-term absences transition into long-term disability, which may indicate undiagnosed occupational disease or inadequate early intervention.
- Correlation with known hazard exposures: Cross-referencing absence patterns with workplace exposure data to test whether health outcomes align with identified hazards.
12. Workers’ Compensation Data Analysis
Workers’ compensation data analysis examines the claims, costs, and outcomes processed through workers’ compensation insurance systems. This method is distinct from general insurance claims analysis because it focuses specifically on employee injury and illness claims and carries detailed medical, occupational, and financial information.
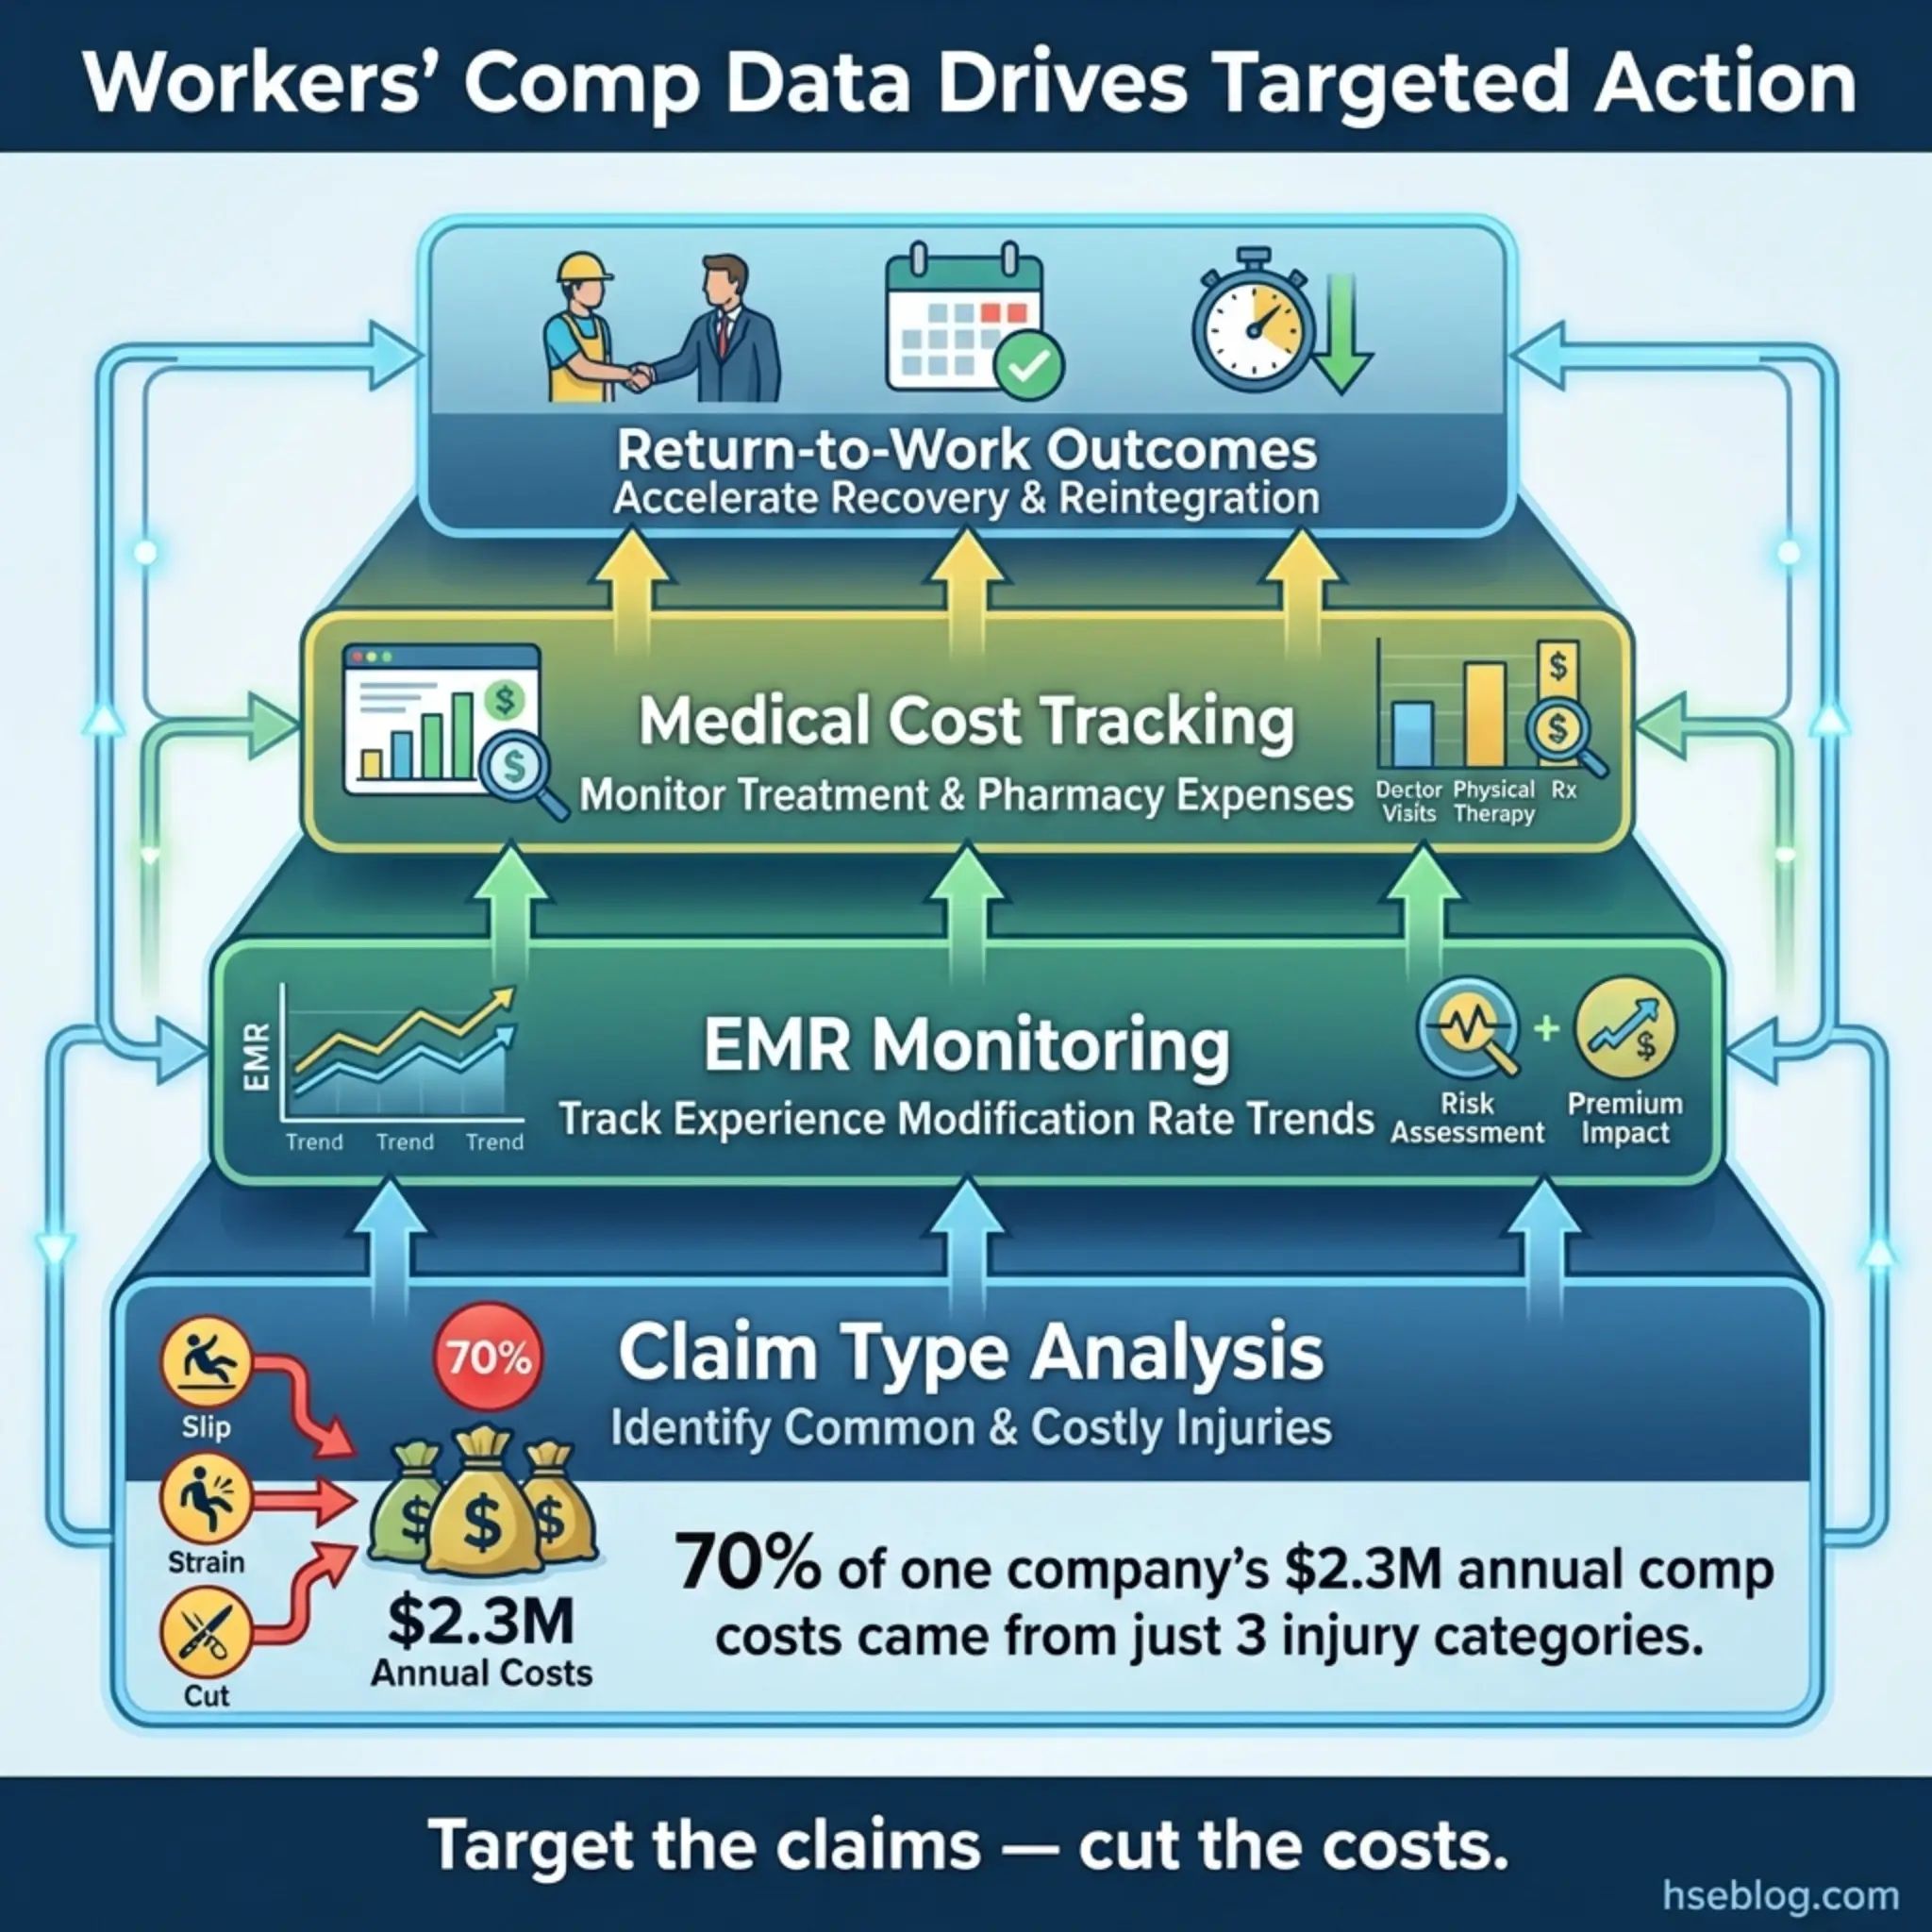
A construction company I advised was spending $2.3 million annually on workers’ compensation premiums — nearly triple the industry benchmark for their size and activity type. When we analyzed the underlying claims data, seventy percent of costs were driven by just three claim categories: lumbar strain from manual handling, knee injuries from repetitive kneeling, and shoulder injuries from overhead work. The company had a generic “manual handling training” program. They needed targeted ergonomic interventions for three specific task types.
Workers’ compensation data delivers reactive monitoring value through the following mechanisms:
- Claim type analysis: Categorizing claims by injury type, body part, mechanism, and severity to identify the most frequent and costly failure modes.
- Experience modification rate (EMR) monitoring: Tracking the organization’s EMR — a multiplier applied to insurance premiums based on historical loss experience — as a composite metric of overall safety performance relative to industry peers.
- Medical cost escalation tracking: Monitoring which claim types generate the highest medical costs and longest treatment durations, which often indicates inadequate early intervention or return-to-work support.
- Denied claims review: Analyzing claims that were denied or disputed to determine whether the denial reflects a genuine non-work-related condition or a gap in how the organization documented and supported the claim.
- Return-to-work outcome measurement: Tracking how quickly and successfully injured workers return to full duty, modified duty, or alternate work — a measure of both the severity of the original event and the effectiveness of the rehabilitation process.
13. Emergency Response Evaluation
Emergency response evaluation is a post-event reactive monitoring method that assesses how effectively the organization responded to an actual emergency — fire, explosion, chemical release, structural collapse, medical emergency, or natural disaster. This differs from emergency drill evaluation (which is proactive) because it measures real-world performance under genuine stress and consequence.
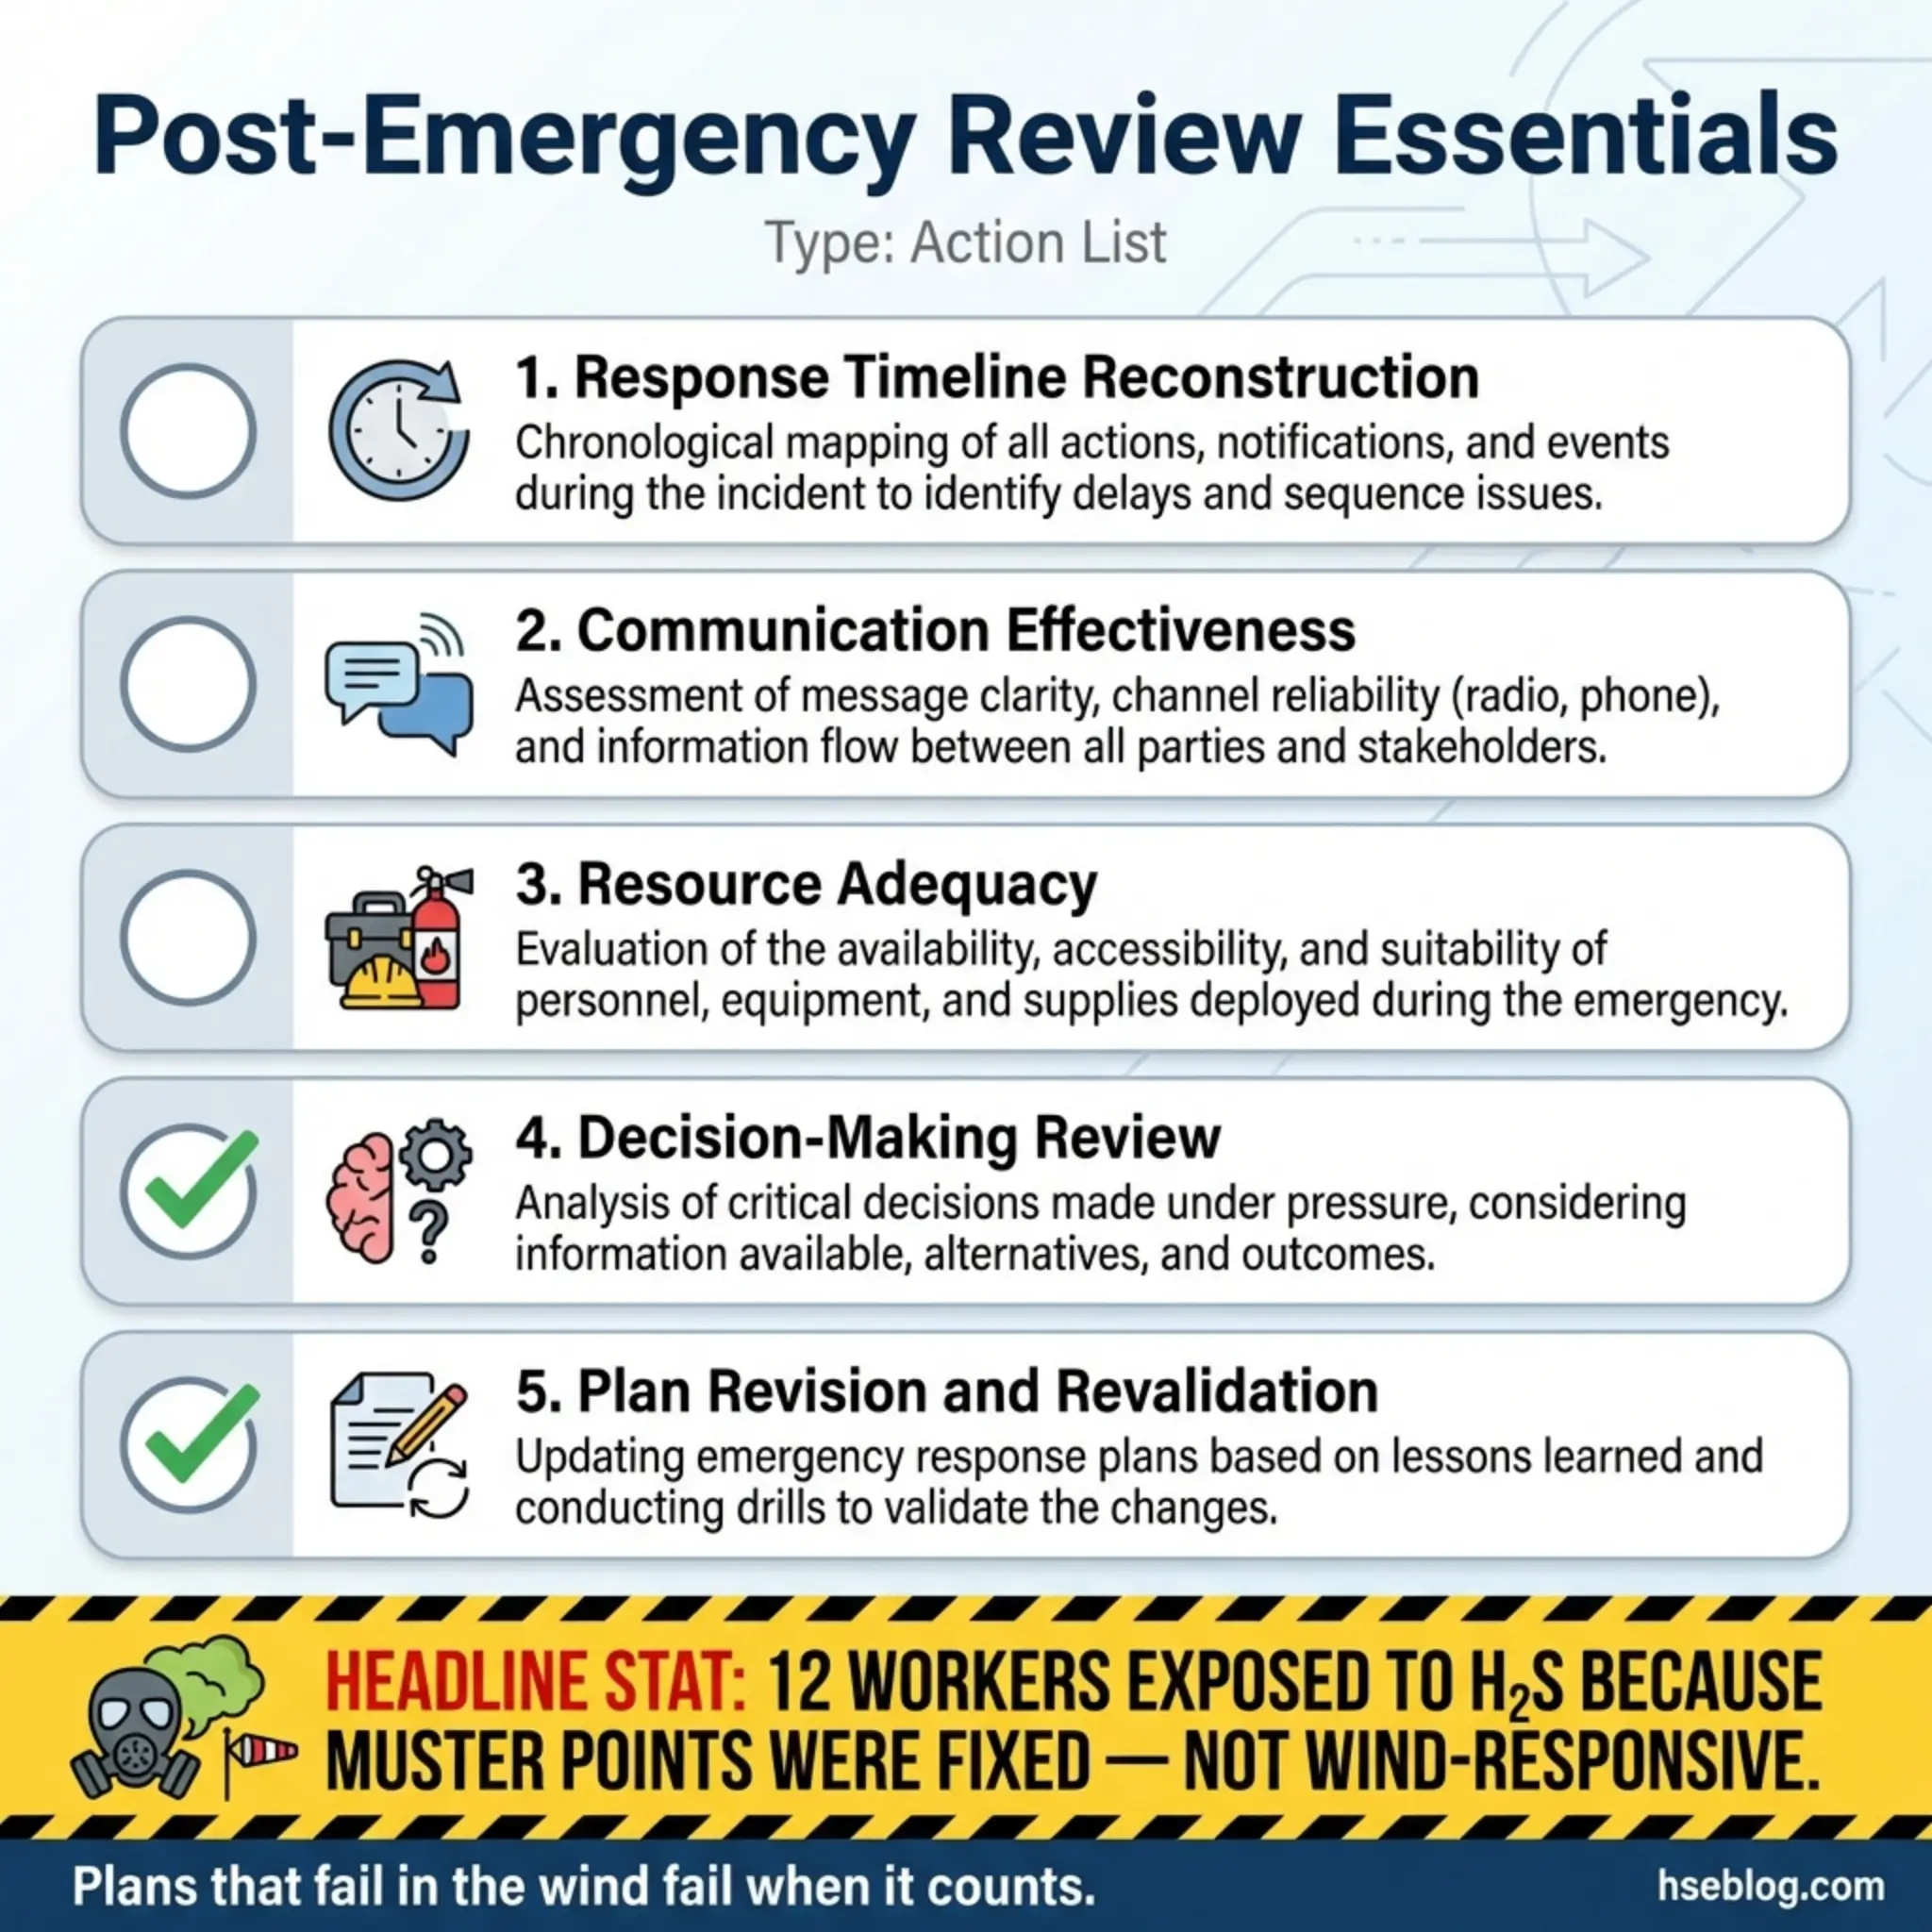
During a refinery emergency in the Gulf — a hydrogen sulfide release that triggered a full site evacuation — I participated in the post-incident review. The emergency plan had been drilled quarterly. On paper, it was robust. In reality, three of the four muster points were downwind of the release. The wind had shifted direction between the initial alarm and the evacuation order, and the muster point assignments were fixed rather than wind-responsive. Twelve workers reported H₂S exposure symptoms. The plan worked on paper. It failed in the wind.
Post-emergency evaluation captures lessons through specific review elements:
- Response timeline reconstruction: Mapping the exact sequence and timing of detection, alarm activation, notification, response actions, and resolution against the planned response timeline.
- Communication effectiveness: Assessing whether information flowed correctly — to the right people, in the right sequence, with the right content — during the emergency.
- Resource adequacy: Evaluating whether emergency equipment, trained responders, and external services were available and sufficient for the actual event scale.
- Decision-making under pressure: Reviewing key decisions made during the emergency — evacuation timing, resource deployment, escalation triggers — for appropriateness and timeliness.
- Gap identification and plan revision: Converting every identified gap into a specific revision of the emergency response plan, with testing and validation requirements.
14. Post-Incident Medical Surveillance
Post-incident medical surveillance is a targeted reactive monitoring method that applies health monitoring to workers who were exposed to a specific hazardous event — even if they showed no immediate symptoms. This method bridges the gap between acute incident response and long-term occupational health monitoring.
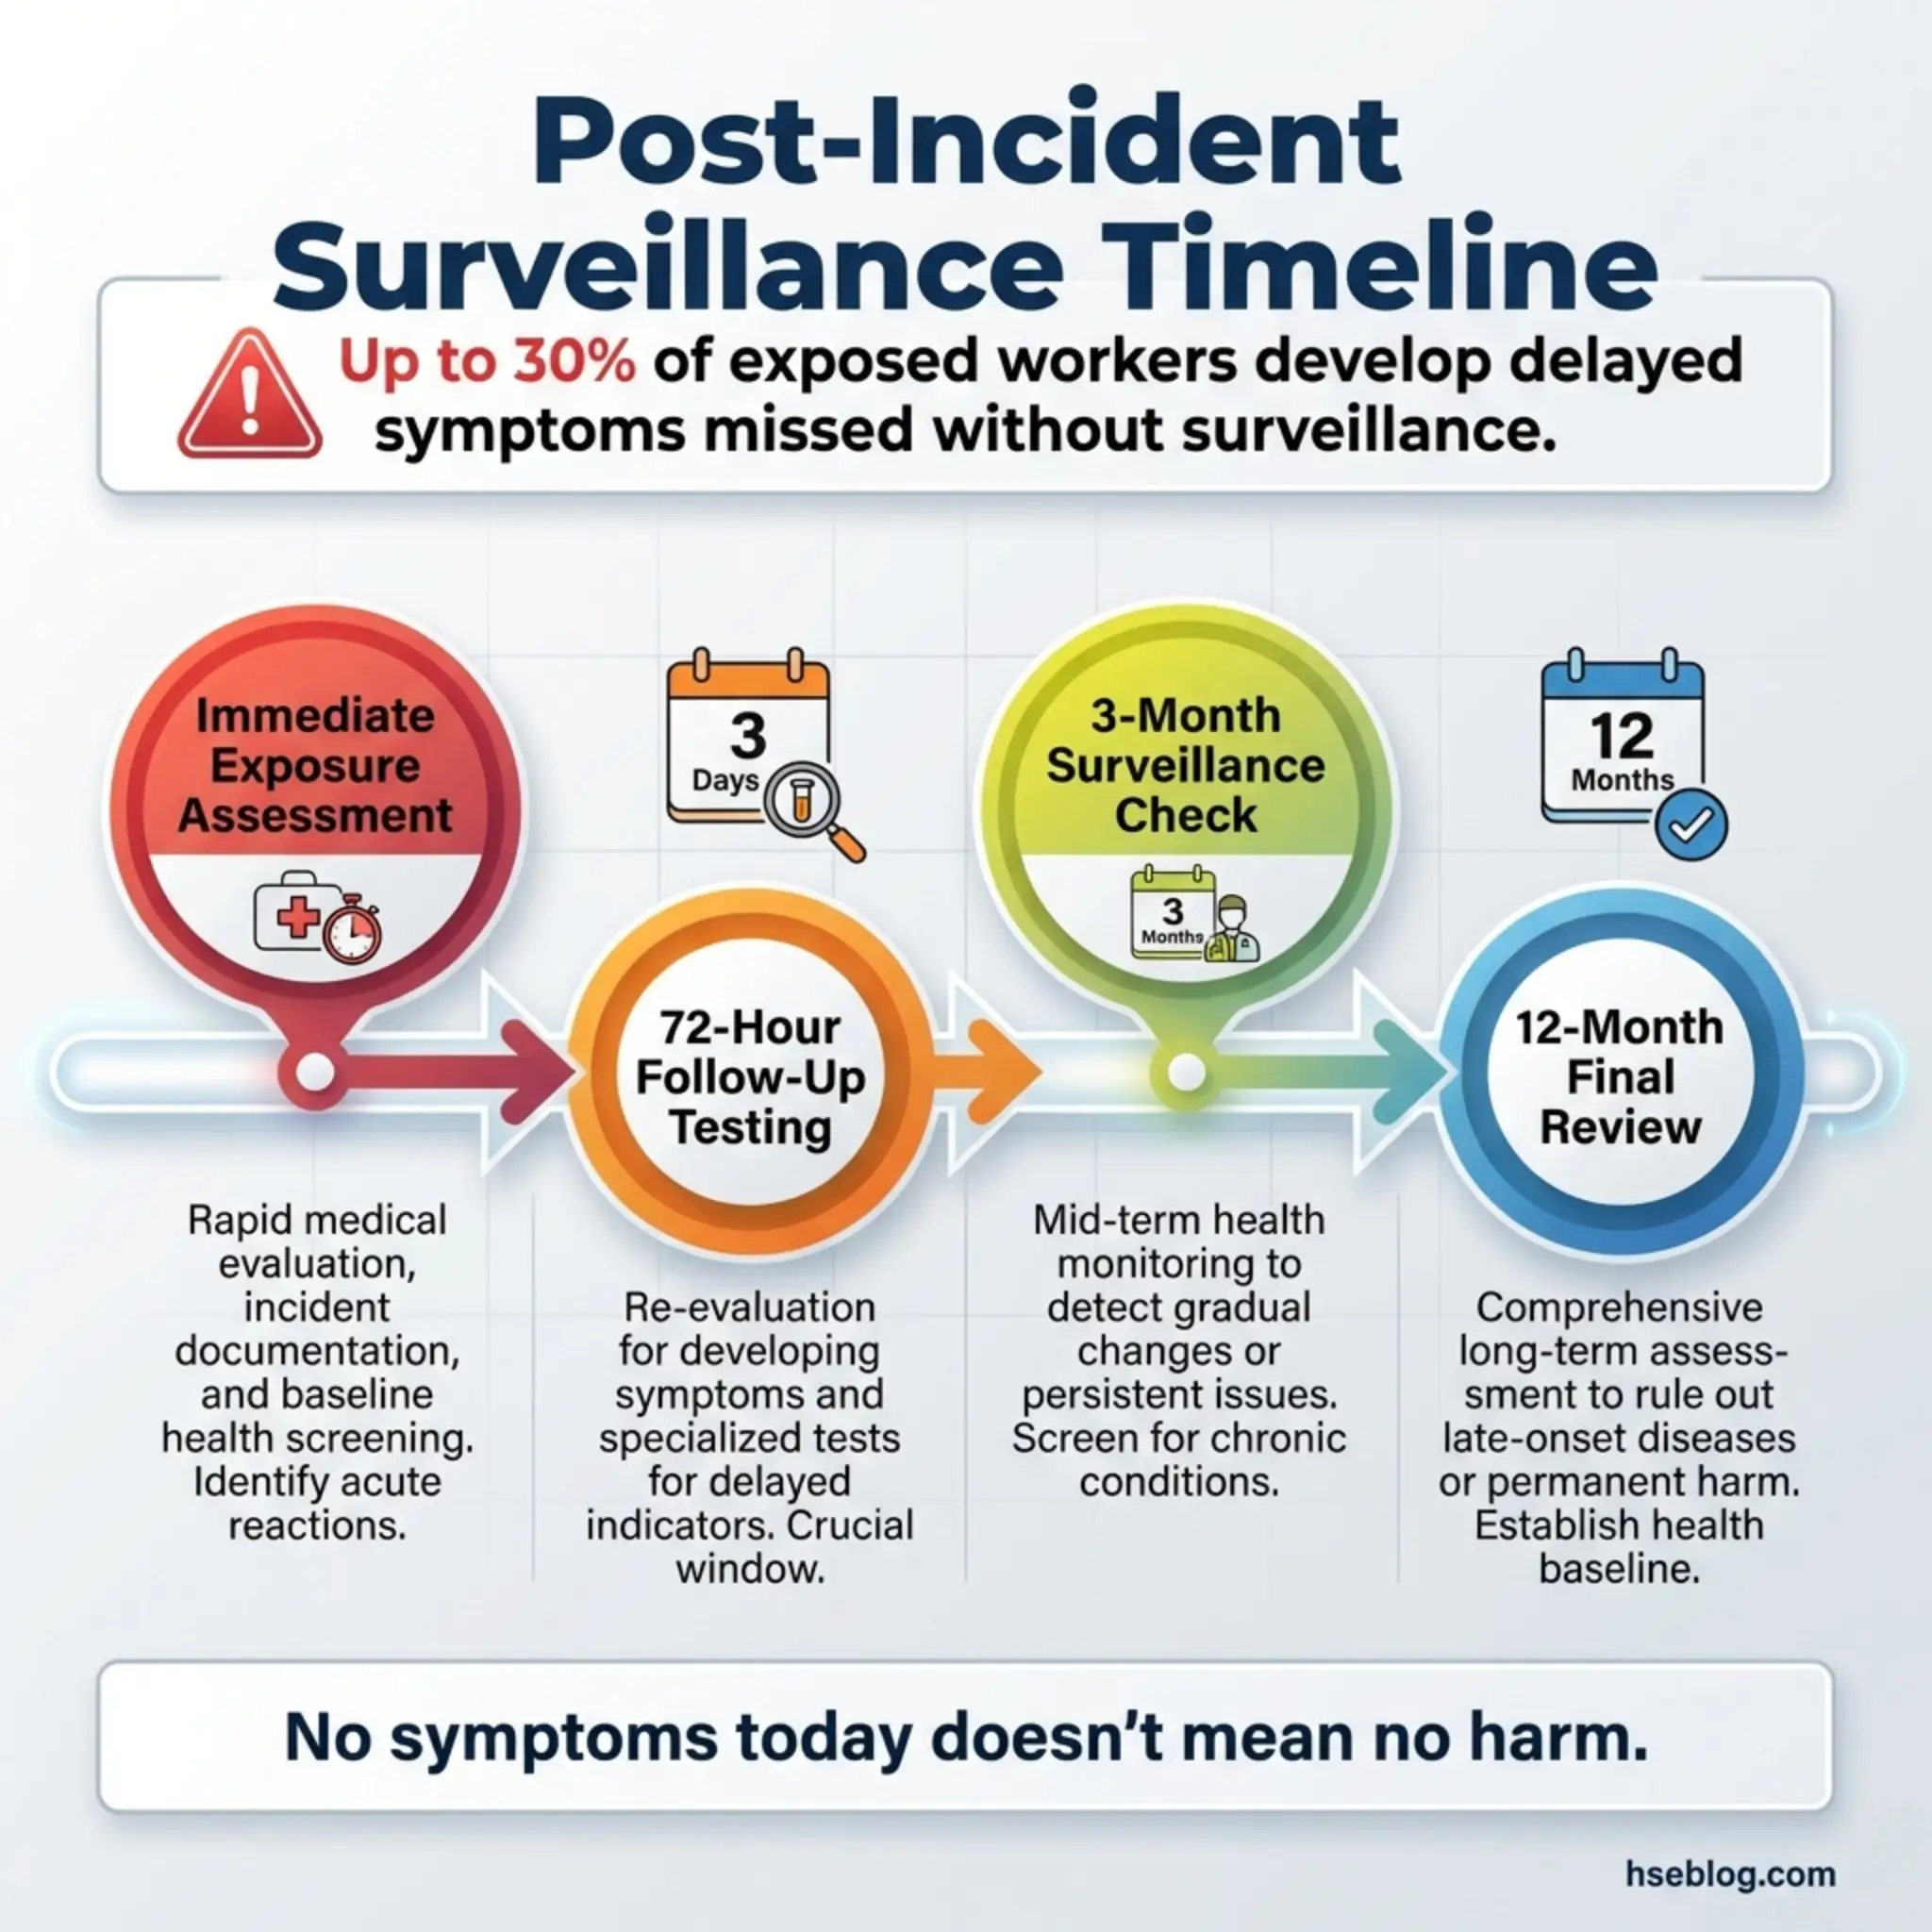
After a chemical tank overfill at a water treatment facility released a chlorine cloud that drifted across a work area, fourteen workers were in the exposure zone. Only three reported immediate symptoms and received medical treatment. The remaining eleven reported feeling fine and returned to work. I insisted on a structured medical surveillance program for all fourteen — respiratory function testing at 72 hours, two weeks, three months, and twelve months post-exposure. At the three-month mark, two of the “asymptomatic” workers showed measurable decline in FEV1 values. Without post-incident surveillance, those cases would have gone undetected until symptoms became severe.
Post-incident medical surveillance should include the following components:
- Exposure cohort identification: Determining every individual who was in the affected zone during the incident, regardless of whether they reported symptoms.
- Substance-specific monitoring protocols: Designing surveillance tests based on the specific substance or hazard involved — respiratory function for inhalation exposures, blood monitoring for chemical absorption, audiometry for blast events.
- Scheduled follow-up intervals: Establishing a monitoring schedule that reflects the latency characteristics of the specific exposure — some effects appear within days, others within months or years.
- Medical record linkage: Ensuring post-incident surveillance data is linked to the individual’s occupational health record and the incident investigation file.
- Trigger thresholds for intervention: Defining what test results will trigger further medical investigation, treatment, or workplace adjustments.
15. Benchmarking Against Industry Incident Data
Benchmarking against industry incident data is a comparative reactive monitoring method that places an organization’s safety performance in context against sector peers, national averages, and international standards. Without benchmarking, an organization has no way to know whether its reactive monitoring data represents good performance, average performance, or a crisis waiting to happen.
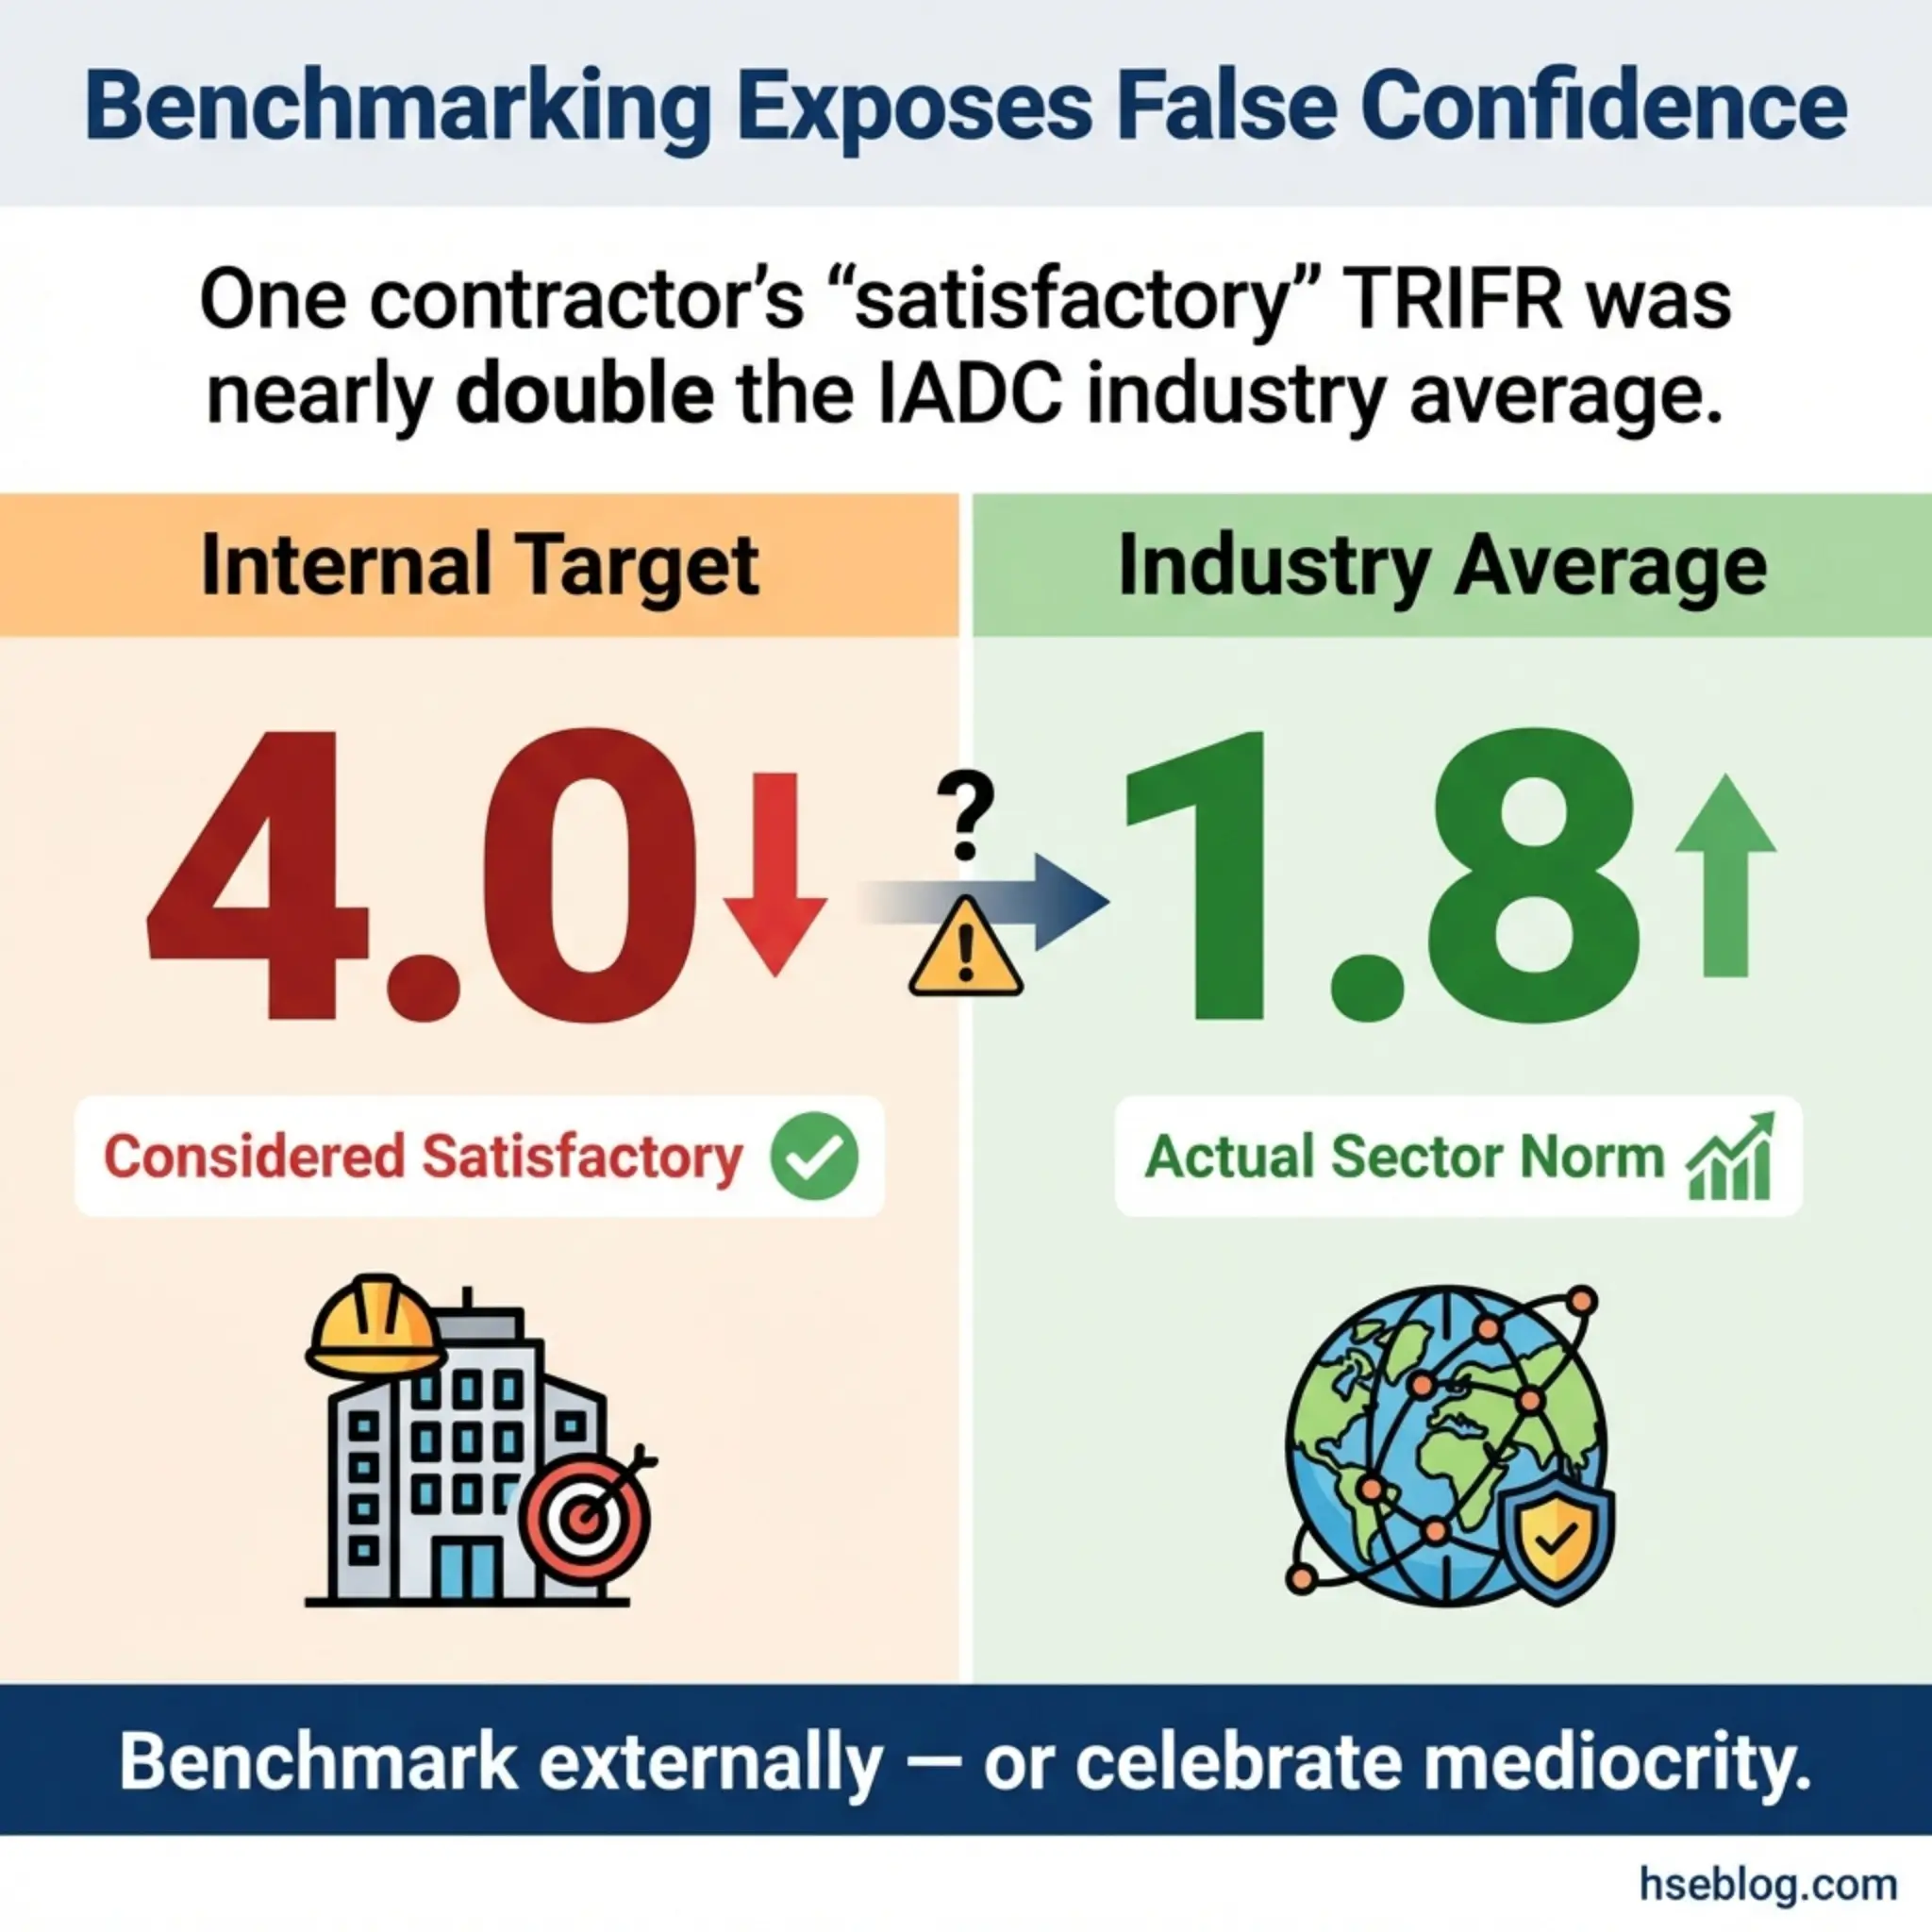
I worked with an offshore drilling contractor who reported a total recordable injury frequency rate (TRIFR) of 3.2 per million hours worked. Their internal target was 4.0, so management considered performance satisfactory. When we benchmarked against the International Association of Drilling Contractors (IADC) dataset for the same operational category, the industry average was 1.8. Their “satisfactory” performance was nearly double the sector norm. The internal target was the problem — it had been set against the company’s own historical performance, not against external reality.
Effective benchmarking as a reactive monitoring method requires discipline in several areas:
- Like-for-like comparison: Benchmarking only against operations of similar type, scale, and risk profile. Comparing a heavy construction site to a retail office invalidates the exercise.
- Consistent metric definitions: Ensuring that the definitions of recordable injury, lost time, and severity classification align between the organization’s data and the benchmark dataset.
- Multiple metric comparison: Using LTIFR, TRIFR, severity rates, fatality rates, and occupational disease rates in combination — never relying on a single metric that can be gamed or misrepresent actual performance.
- Trend comparison over time: Comparing not just snapshot values but performance trajectories — is the organization improving, plateauing, or deteriorating relative to the industry trend?
- Source credibility: Using benchmark data from recognized industry bodies (IADC, IOGP, Bureau of Labor Statistics, HSE UK Annual Statistics) rather than self-selected or commercially sourced datasets.
Pro Tip: If your internal safety targets are set exclusively against your own historical data, you may be celebrating mediocrity. Always validate internal targets against external industry benchmarks before declaring them fit for purpose.
Common Mistakes That Undermine Reactive Monitoring Methods
Even organizations that implement all fifteen reactive monitoring methods can fail to extract value from them. The methods themselves are only as strong as the culture and systems that support them. The following mistakes are the ones I encounter most frequently during audits and management system reviews:
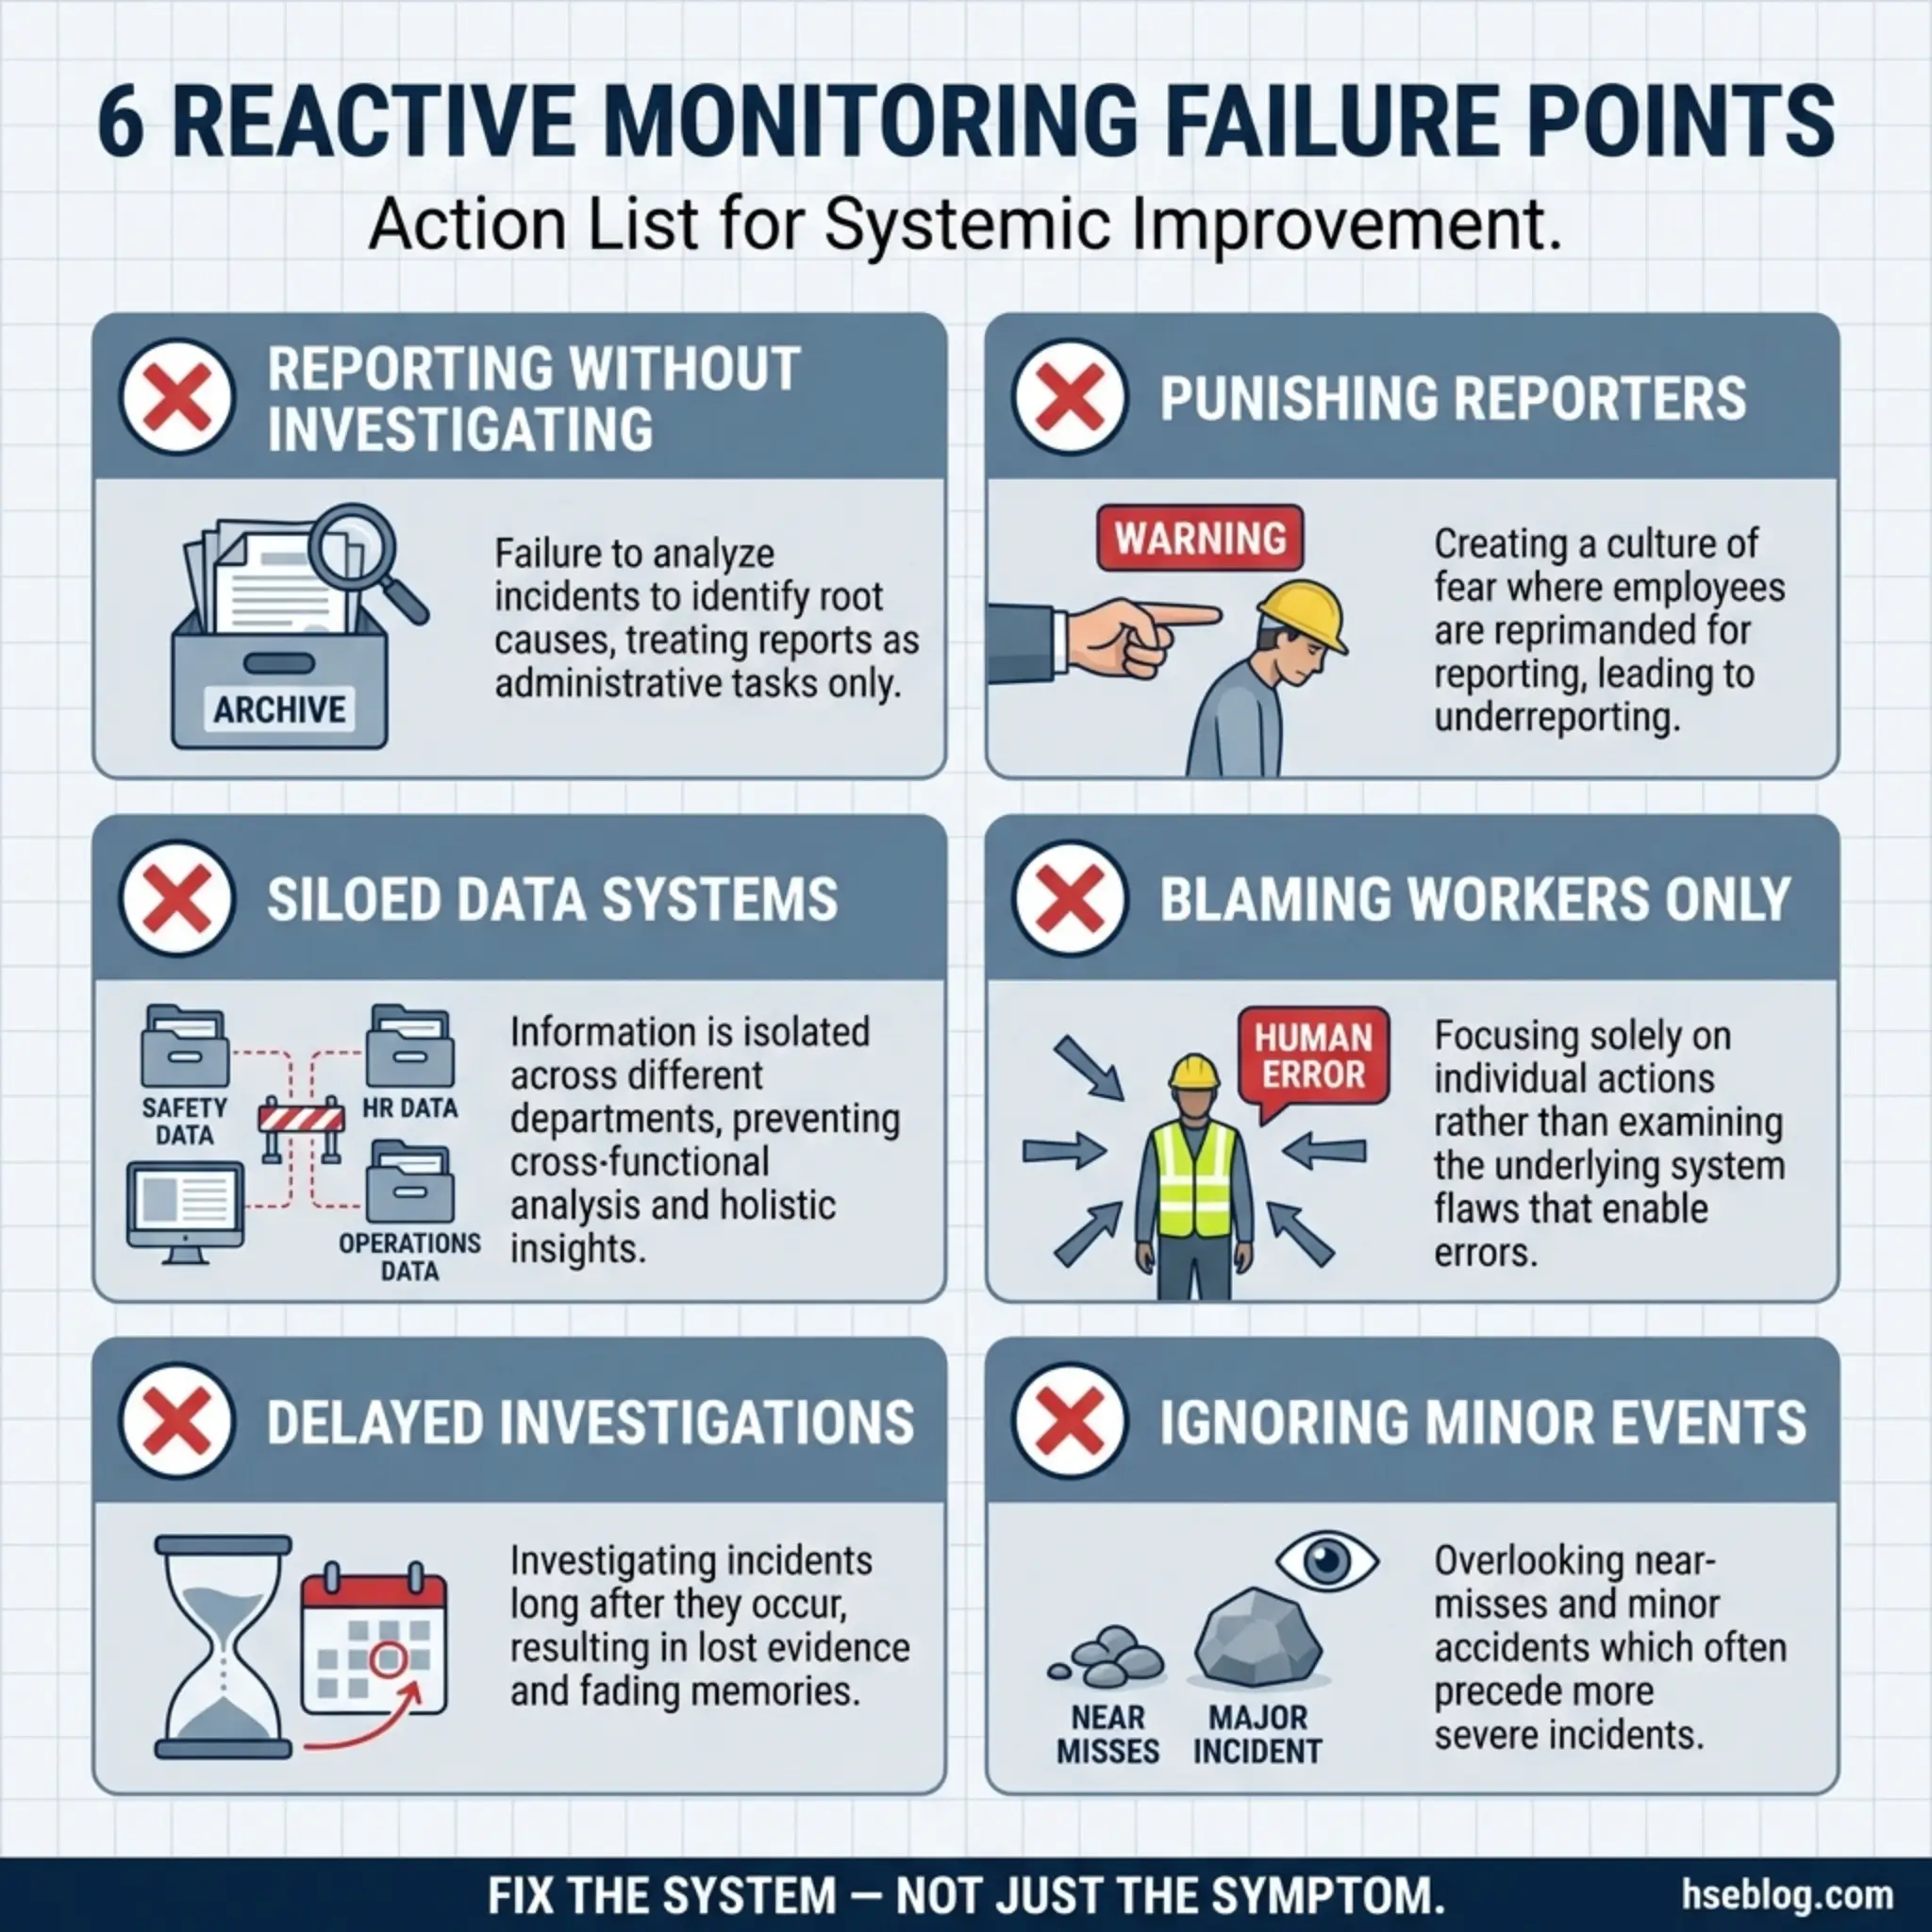
- Treating reporting as the end goal: Many organizations measure the number of reports submitted rather than the quality of investigations completed and corrective actions closed. Volume without analysis is noise.
- Punishing the reporter: When a near-miss report results in a drug test, a warning letter, or a public reprimand during a toolbox talk, the reporting system dies within weeks. Workers learn fast.
- Siloed data management: Keeping safety incidents, environmental events, insurance claims, absenteeism data, and enforcement actions in separate systems managed by separate departments prevents pattern recognition across data streams.
- Investigating symptoms instead of systems: Concluding that an accident was caused by “worker error” without examining the supervision, training, design, and management failures that created the conditions for that error.
- Delayed investigation: Evidence degrades within hours. Witness memories shift within days. Equipment gets repaired, scenes get cleaned up, and the opportunity for accurate root cause analysis evaporates.
- Ignoring low-severity events: Organizations that only investigate serious injuries miss the massive volume of first aid cases, near-misses, and property damage events that contain the same systemic failure signals.
Reactive Monitoring Methods vs. Proactive Monitoring: The Complete Picture
Reactive monitoring and proactive monitoring are complementary — not competing — approaches. Neither can replace the other, and organizations that rely exclusively on one type develop blind spots that the other would catch. Understanding how these two approaches interact is essential for building a balanced safety management system.
The following table illustrates the core differences and complementary roles:
| Feature | Reactive Monitoring | Proactive Monitoring |
|---|---|---|
| Trigger | After an event occurs | Before any event occurs |
| Indicator type | Lagging indicators | Leading indicators |
| Data source | Incidents, injuries, ill health, losses | Inspections, audits, observations, training records |
| Measures | Failure outcomes | Control effectiveness |
| Strength | Reveals what actually went wrong | Identifies what could go wrong |
| Weakness | Requires harm or near-harm to generate data | May miss unforeseeable failure modes |
| Regulatory role | Mandatory reporting obligations | Compliance verification |
| Management value | Drives corrective action | Drives preventive action |
Neither column is “better.” A site with excellent proactive monitoring but weak reactive monitoring will miss the lessons from actual failures. A site with strong reactive monitoring but no proactive systems is simply waiting for the next event to tell them what’s broken.
How to Build an Integrated Reactive Monitoring Framework
The fifteen reactive monitoring methods covered in this article only deliver their full value when integrated into a coherent framework. Standalone methods produce standalone data. Integration produces organizational learning.
Building that framework requires a deliberate, structured approach:
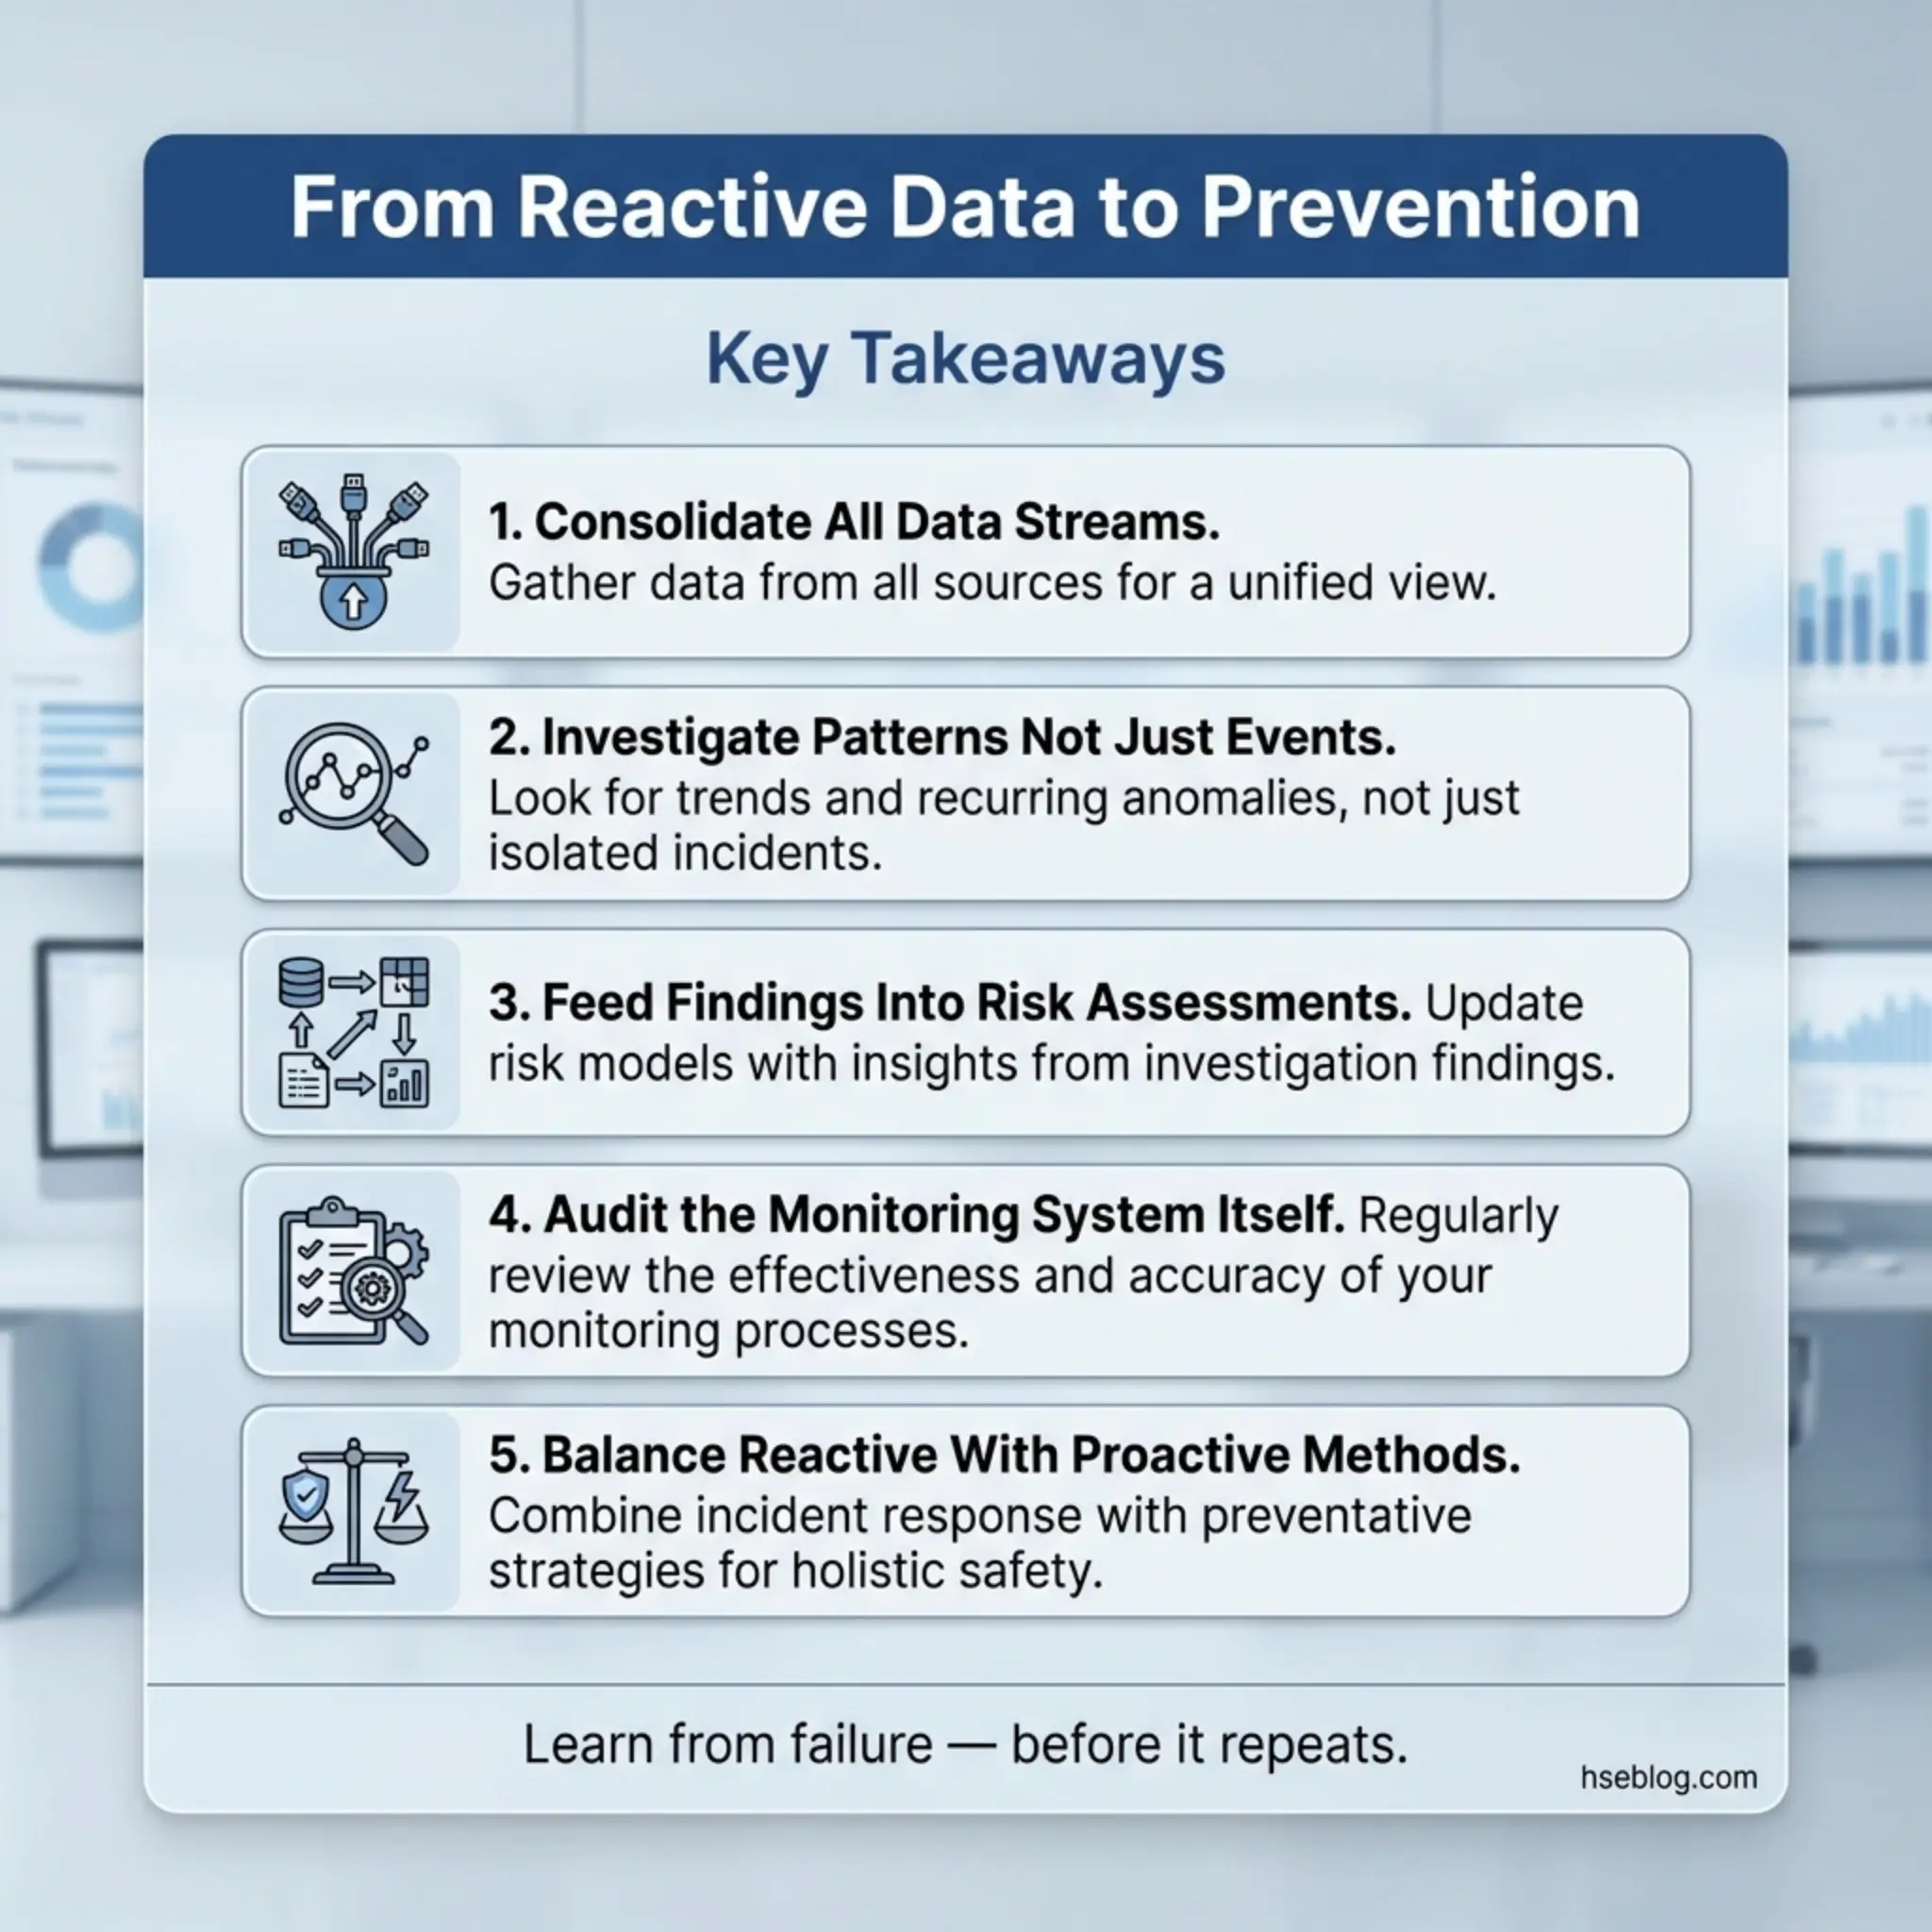
- Map all existing reactive data streams: Identify every source of reactive data currently flowing through the organization — incident reports, first aid logs, insurance claims, absenteeism records, regulatory correspondence, complaint registers, and environmental monitoring data.
- Consolidate into a single platform or dashboard: Bring all reactive data into a unified system where cross-referencing and pattern analysis can occur. This does not require expensive software — a well-structured spreadsheet managed by a competent analyst can serve smaller organizations.
- Define investigation triggers and escalation criteria: Establish clear thresholds for when each type of reactive data triggers a formal investigation, a management notification, or a regulatory report.
- Assign ownership and accountability: Every reactive monitoring method needs a named owner responsible for data quality, analysis, and corrective action follow-through.
- Establish regular review cycles: Monthly operational reviews, quarterly trend analysis, and annual management reviews that examine all fifteen methods in combination — not in isolation.
- Feed findings back into proactive systems: The entire purpose of reactive monitoring is to improve proactive controls. Investigation findings must update risk assessments, revise safe work procedures, inform training content, and drive resource allocation.
- Audit the monitoring system itself: Periodically assess whether the reactive monitoring methods are capturing what they should be capturing — including deliberate checks for under-reporting, delayed reporting, and investigation quality gaps.
Conclusion
Reactive monitoring methods are not a sign of failure — they are a sign that the organization is paying attention to what its operations are actually producing. Every accident report, near-miss submission, first aid entry, insurance claim, and enforcement notice carries a message about where the safety management system broke down and what needs to change. The fifteen methods covered in this article — from accident investigation and near-miss reporting to benchmarking and post-incident medical surveillance — each capture a different frequency of failure signal. Used together, they create a comprehensive picture of organizational safety performance that no single metric can provide.
The critical distinction between organizations that learn and those that repeat is what happens after the data is collected. Filing reports is administrative work. Investigating root causes, closing corrective actions, updating risk assessments, and feeding findings into proactive systems — that is safety management. I have audited organizations with beautifully formatted incident databases containing thousands of records and zero evidence that any of those records changed a single work practice on the ground.
Every reactive data point represents a moment where the system allowed harm, near-harm, or loss to occur. The only ethical response is to ensure that moment becomes the last time that specific failure sequence plays out. Reactive monitoring methods don’t prevent the first incident — but they should prevent every subsequent one. If they’re not doing that, the system isn’t broken. It was never built.