

TL;DR
- TRIR measures every OSHA-recordable injury per 200,000 hours worked — not just lost-time events.
- The formula is straightforward: (Recordable Incidents × 200,000) ÷ Total Hours Worked.
- A good TRIR depends on your industry; the U.S. all-industry average sits around 2.8 per BLS data.
- TRIR is a lagging indicator — it tells you what already happened, not what’s about to go wrong.
- Reducing TRIR requires upstream action: near-miss reporting, hazard observations, and leadership engagement drive real improvement.
I was reviewing a contractor’s pre-qualification package for a petrochemical turnaround project in the Gulf when a single number made me stop reading. Their Total Recordable Incident Rate was 8.4. For context, the industry average for petroleum refining hovers around 1.2. That number told me more about their safety culture, management commitment, and field discipline than sixty pages of policies and procedures ever could.
TRIR — Total Recordable Incident Rate — is one of the most widely used safety performance metrics in the world. Clients demand it. Insurers price premiums around it. Regulators benchmark against it. Yet I’ve sat in boardrooms where senior managers couldn’t explain what a “recordable incident” actually includes, and I’ve watched site supervisors misclassify injuries to keep the number low. This article breaks down exactly what TRIR is, how to calculate it accurately, what makes a good rate, where organizations get it wrong, and — most critically — how to drive it down through genuine operational improvement rather than creative record-keeping.
What Is Total Recordable Incident Rate (TRIR)?
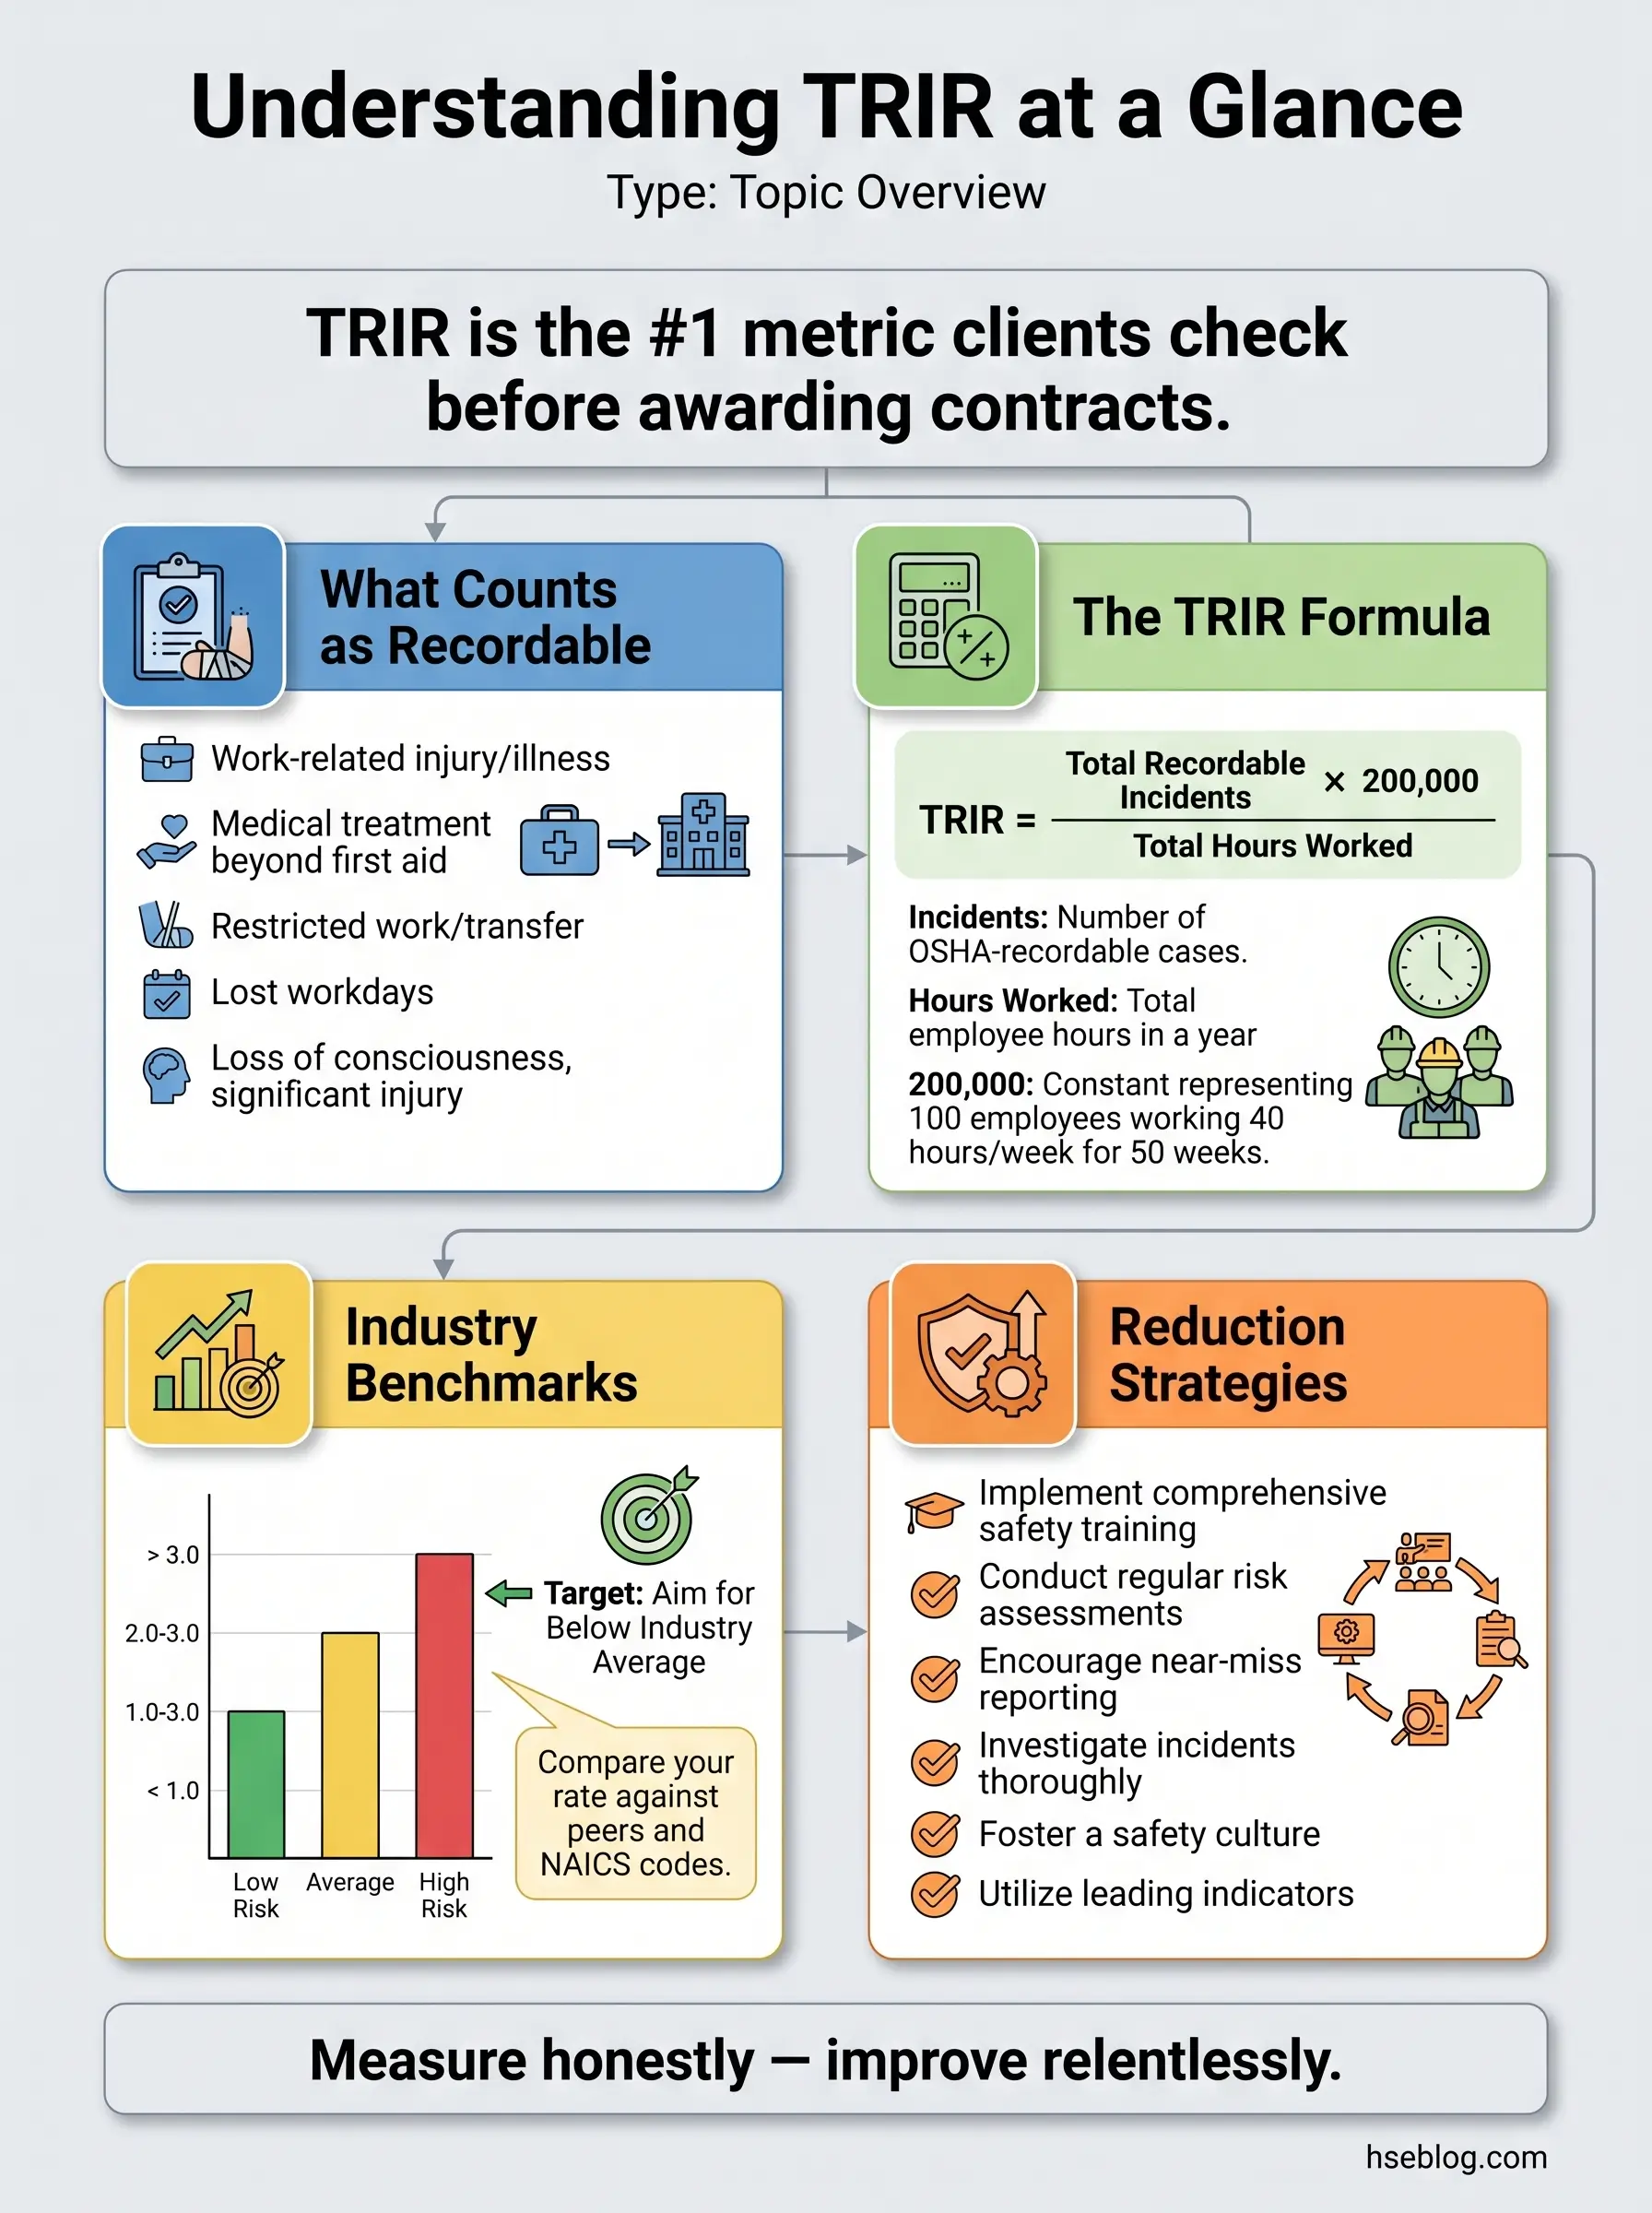
Total Recordable Incident Rate is a standardized safety metric that calculates the number of OSHA-recordable workplace injuries and illnesses per 200,000 hours worked. The 200,000-hour figure represents the approximate annual hours of 100 full-time employees, which normalizes the data so organizations of different sizes can be compared on equal footing.
TRIR captures a broader picture than metrics that only count lost-time injuries. It includes every recordable case — from a medical treatment beyond first aid to a fatality — giving organizations a more complete view of their injury burden. OSHA’s recordkeeping standard, 29 CFR Part 1904, defines exactly which injuries and illnesses qualify as recordable, and that classification is where most confusion starts.
The distinction between TRIR and other metrics matters in practice. I’ve audited operations that celebrated a zero lost-time injury record while accumulating dozens of medical treatment cases and restricted work assignments. Their LTIFR looked flawless. Their TRIR told the real story.
OSHA 29 CFR 1904.7 requires employers to record work-related injuries and illnesses that result in death, days away from work, restricted work or job transfer, medical treatment beyond first aid, loss of consciousness, or a significant injury or illness diagnosed by a physician.
What Counts as an OSHA Recordable Incident?
Understanding which incidents feed into the TRIR calculation is the foundation of accurate reporting. Misclassification — whether accidental or deliberate — corrupts the metric and exposes organizations to regulatory penalties.
The following incident types are OSHA-recordable and must be included in every TRIR calculation:
- Fatalities: Any work-related death, regardless of the time between injury and death.
- Days away from work (DAFW): Injuries or illnesses serious enough that the employee cannot report for their next scheduled shift.
- Restricted work or job transfer: Cases where the employee can work but cannot perform all routine functions of their position, or is moved to a different role.
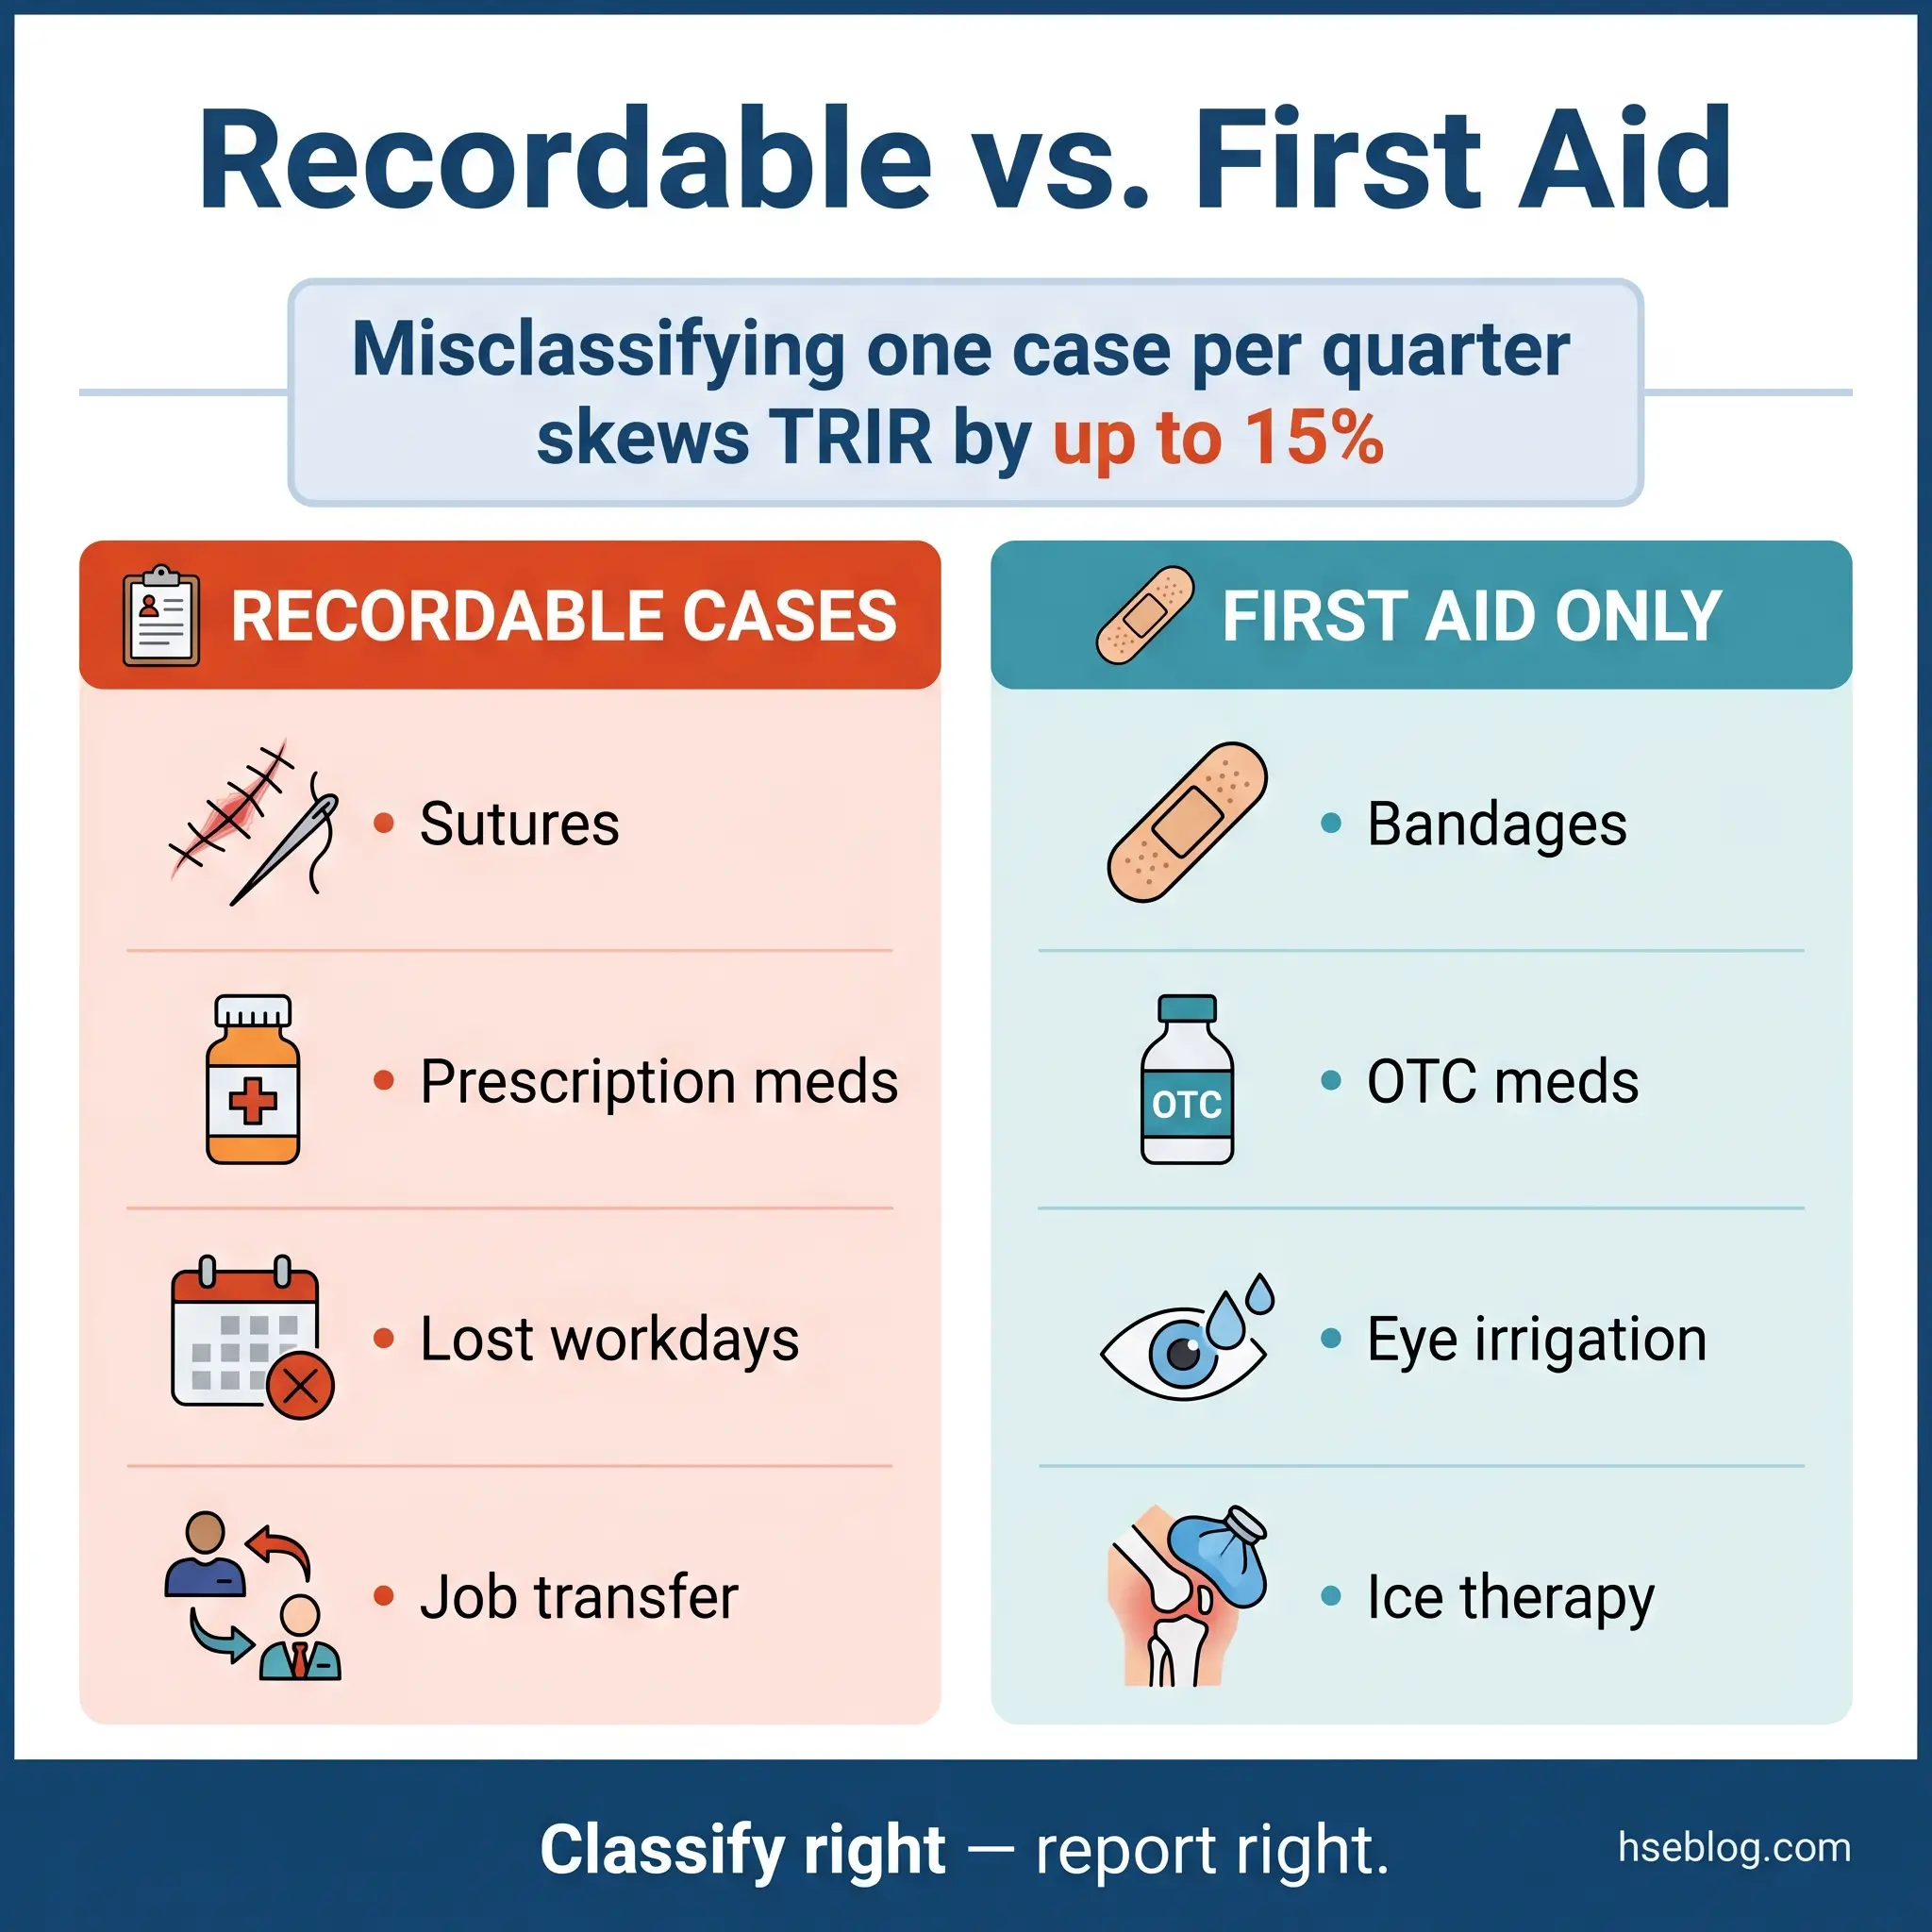
- Medical treatment beyond first aid: Any treatment that goes beyond OSHA’s defined first-aid list — sutures, prescription medications, physical therapy, second-degree burn treatment, and removal of foreign bodies from the eye using specialized instruments all qualify.
- Loss of consciousness: Any work-related event causing the employee to lose consciousness, even briefly.
- Significant diagnosed conditions: A physician or licensed healthcare professional diagnoses a significant injury or illness, such as a fracture, punctured eardrum, or chronic condition linked to occupational exposure.
Knowing what does NOT count is equally critical. The following are classified as first aid under OSHA and are excluded from recordable incident counts:
- Non-prescription medications at non-prescription strength — administering ibuprofen or acetaminophen
- Wound cleaning and surface dressings — butterfly bandages, Steri-Strips, basic wound irrigation
- Hot or cold therapy application
- Rigid splints and elastic bandages for first-time use
- Tetanus immunizations administered as a precautionary measure
- Eye patches and removal of foreign bodies from the eye using irrigation or a cotton swab (not specialized instruments)
- Finger guards, non-prescription orthotic devices, and simple elastic wraps
- Oxygen administration and basic observation without further treatment
Pro Tip: The line between “first aid” and “medical treatment” trips up even experienced safety professionals. Print OSHA’s first-aid definition list from 29 CFR 1904.7(a) and post it in every site medical station. When the site medic reaches for prescription-strength medication or suture material, that’s the moment the case becomes recordable — and the moment your TRIR changes.
The TRIR Formula and How to Calculate It
The TRIR calculation itself is simple arithmetic. The challenge lies in feeding accurate numerator and denominator values into the formula.
The standard formula used across all OSHA-regulated industries is:
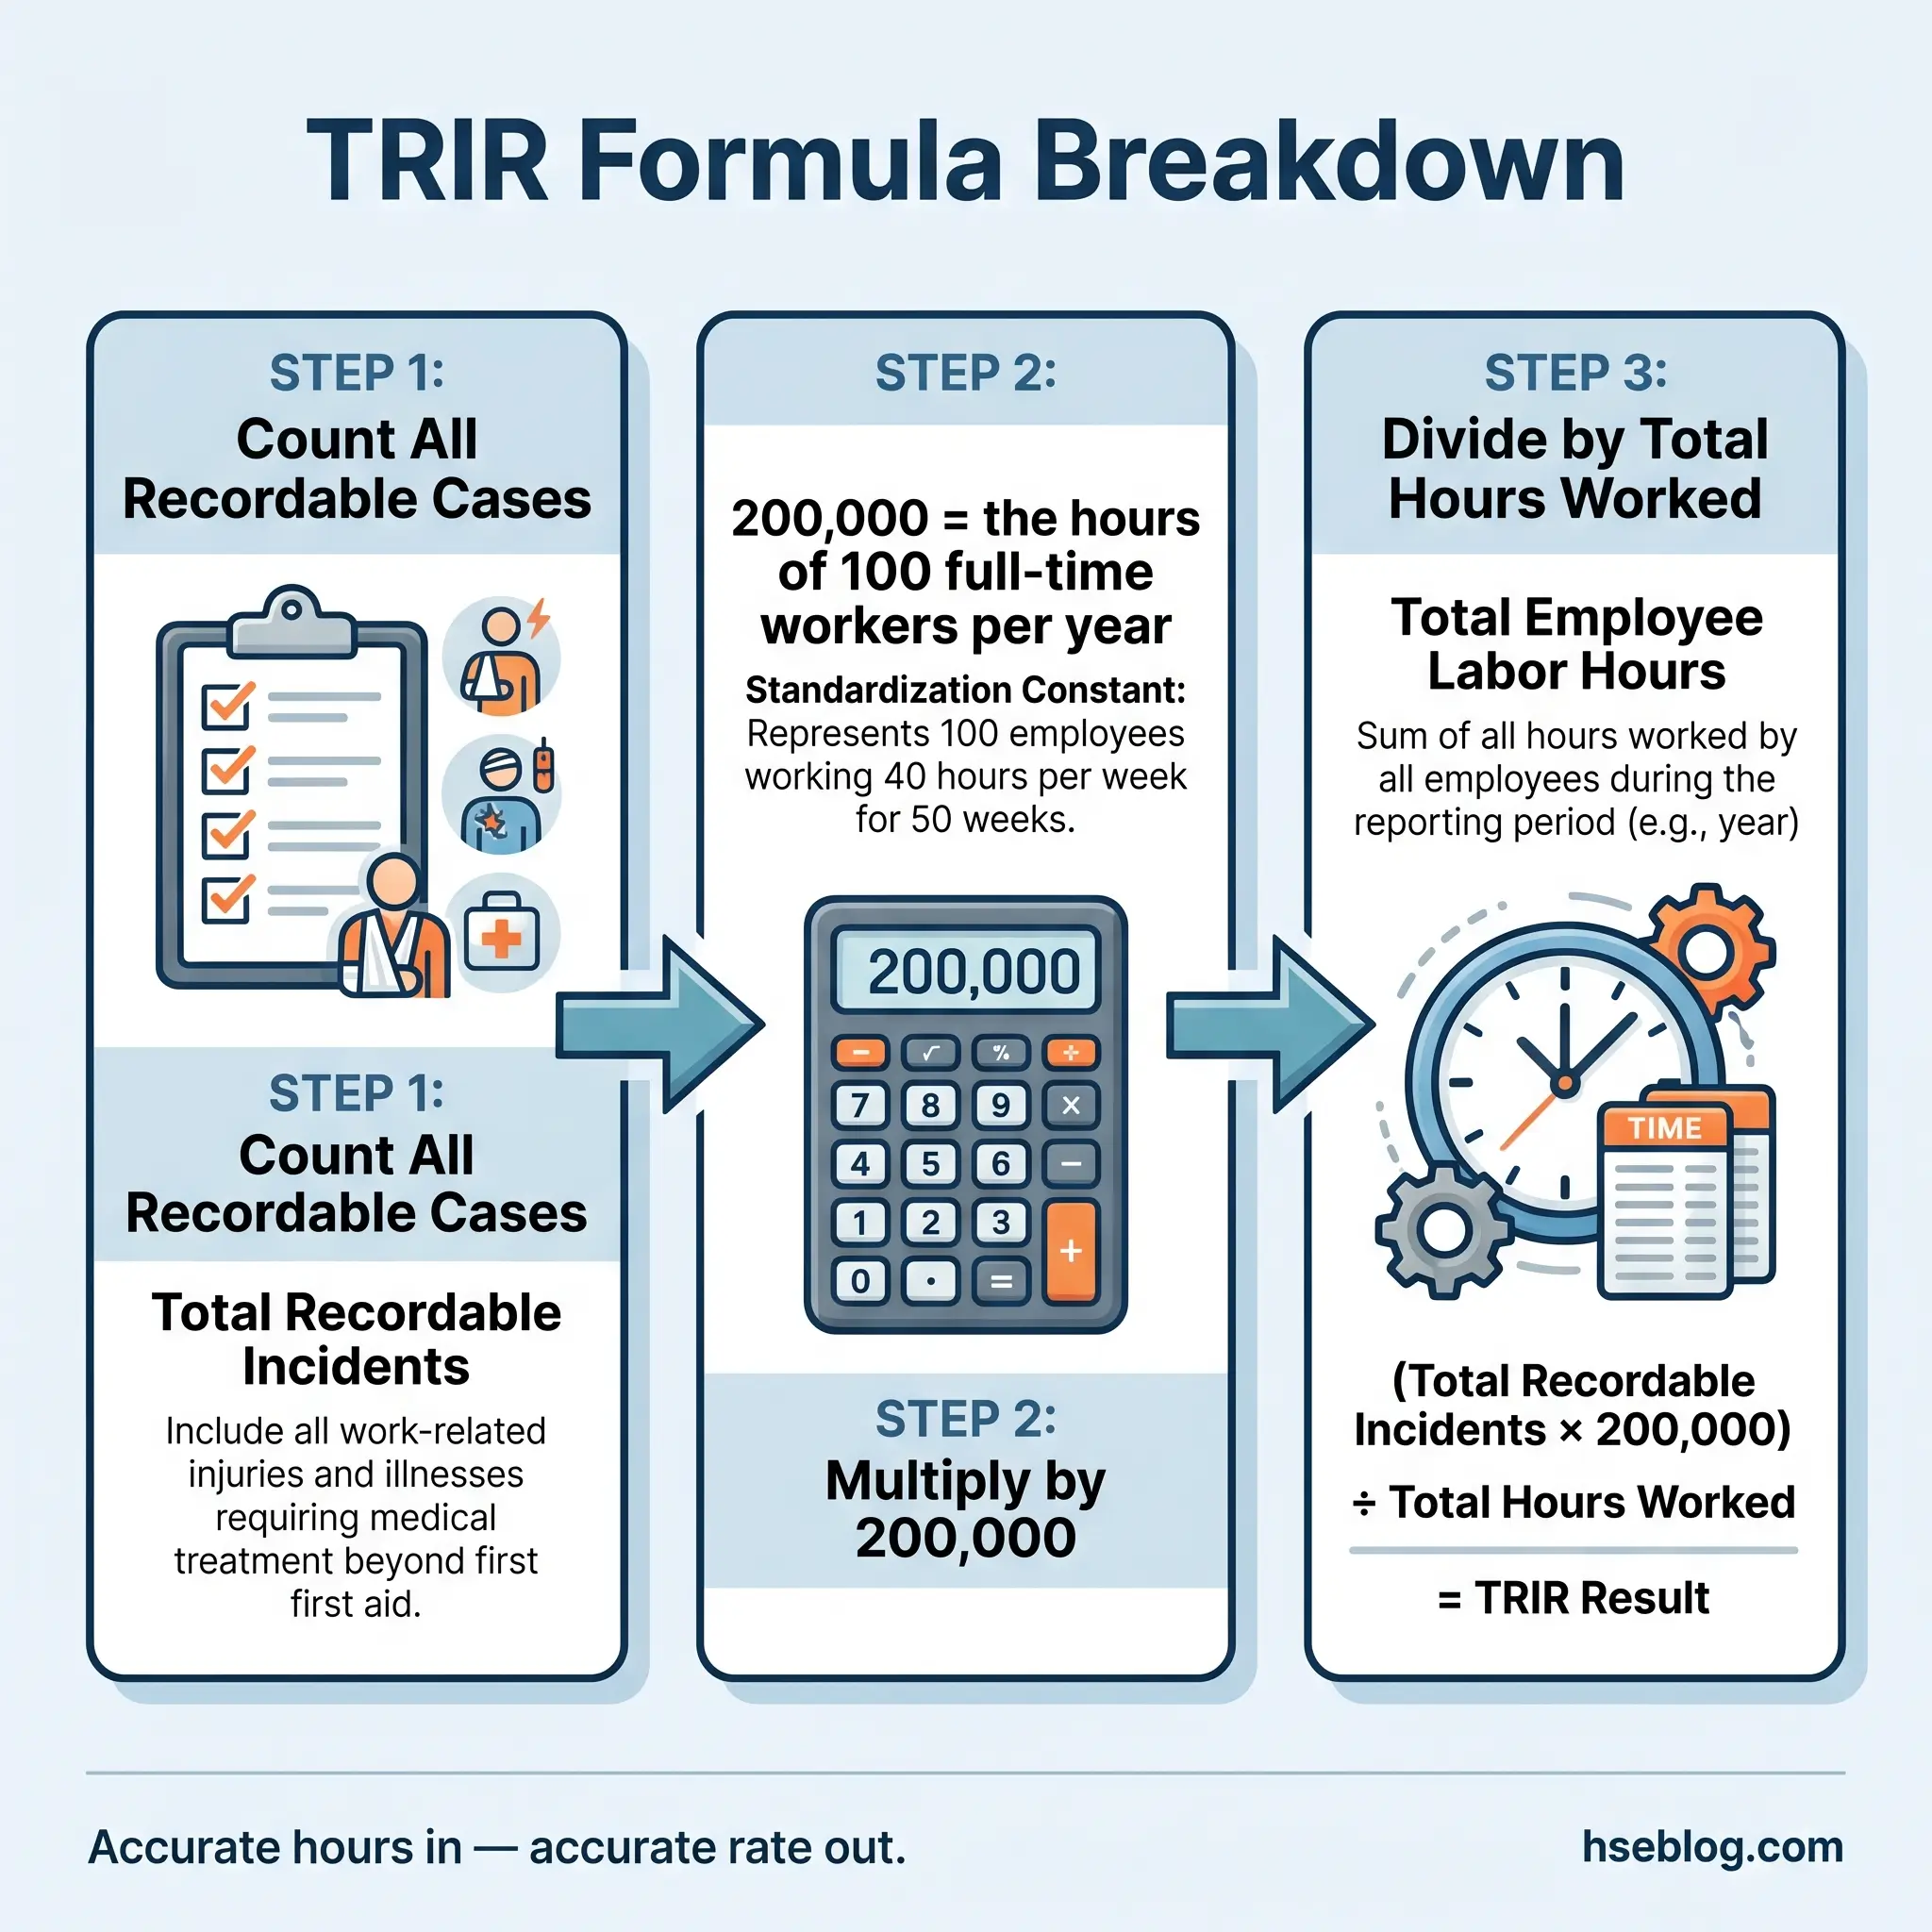
TRIR = (Number of Recordable Incidents × 200,000) ÷ Total Hours Worked
Each component requires precision:
- Number of Recordable Incidents: The total count of all OSHA-recordable cases (fatalities + DAFW + restricted/transfer + medical treatment + loss of consciousness + significant diagnosed conditions) within the reporting period.
- 200,000: The standardization constant representing 100 full-time employees working 40 hours per week for 50 weeks.
- Total Hours Worked: The actual hours worked by all employees during the same period. This includes overtime but excludes vacation, sick leave, holidays, and any other non-work hours.
TRIR Calculation Example
A manufacturing facility with 350 employees records the following over a calendar year. Total hours worked across all employees equal 728,000 hours. During that period, the facility recorded 2 lost-workday cases, 3 restricted-duty cases, and 4 medical-treatment-only cases — totaling 9 recordable incidents.
Applying the formula:
TRIR = (9 × 200,000) ÷ 728,000 = 2.47
This means for every 100 full-time workers employed for a year, approximately 2.47 suffered a recordable injury or illness.
Common Calculation Errors That Corrupt TRIR
I’ve reviewed TRIR data from hundreds of contractor submissions and client reports. The same errors surface repeatedly, and each one distorts the number in ways that affect bidding, insurance, and regulatory compliance.
These are the mistakes that most frequently compromise TRIR accuracy:
- Excluding contractor hours from the denominator while including contractor incidents in the numerator (or vice versa) — this mismatch inflates or deflates the rate dramatically.
- Using headcount instead of actual hours worked — estimating hours from employee count ignores overtime, part-time workers, and seasonal fluctuations.
- Including non-work hours such as paid leave, training days away from the facility, or travel time in the total hours figure.
- Failing to record restricted-duty cases — some supervisors avoid placing injured workers on restricted duty specifically to prevent a recordable entry, which is both an ethical violation and a regulatory one.
- Backdating or reclassifying incidents after the reporting period closes — adjusting the OSHA 300 log retroactively without proper justification is a compliance red flag that auditors and OSHA inspectors look for.
Pro Tip: Run a quarterly reconciliation between your site medical log, your OSHA 300 log, and your hours tracking system. If the three don’t align, your TRIR is wrong. I’ve found discrepancies in roughly 40% of the sites I’ve audited — and in every case, the error favored a lower rate.
What Is a Good TRIR? Industry Benchmarks and Context
A TRIR number means nothing without context. A rate of 3.0 could be excellent for one industry and alarming for another. The U.S. Bureau of Labor Statistics (BLS) publishes annual injury and illness rates by industry, and these benchmarks are the baseline every HSE professional should reference.
The following table shows approximate TRIR benchmarks based on BLS data. These represent the all-industry average and selected high-risk sectors:
| Industry Sector | Approximate TRIR (per 200,000 hours) |
|---|---|
| All U.S. Private Industry | 2.8 |
| Construction | 2.8 |
| Manufacturing | 3.3 |
| Oil & Gas Extraction | 0.8 |
| Mining (excluding O&G) | 1.7 |
| Transportation & Warehousing | 4.2 |
| Healthcare & Social Assistance | 4.5 |
| Agriculture, Forestry, Fishing | 4.8 |
| Accommodation & Food Services | 3.2 |
| Utilities | 1.8 |
Several important context points shape how these numbers should be interpreted:
- Oil and gas extraction rates appear low partly because of stringent pre-qualification, extensive contractor vetting, and massive safety investment — but also because of industry-specific reporting cultures that safety professionals should evaluate critically.
- Healthcare rates are high not because hospitals are poorly managed, but because the nature of the work — patient handling, needlestick exposure, workplace violence — generates inherent recordable risk.
- Client expectations often differ from BLS averages. Major operators in oil and gas, petrochemical, and mining routinely require contractor TRIRs below 1.0 as a pre-qualification threshold. I’ve seen contracts denied to companies with a TRIR of 1.5 — a rate well below the national average but above the client’s threshold.
Pro Tip: When benchmarking your TRIR, compare against your specific NAICS code, not the broad industry group. A general contractor’s rate should be compared against NAICS 2362 (non-residential building construction), not the umbrella “construction” category. BLS publishes data at this granularity — use it.
TRIR as a Lagging Indicator: Strengths and Limitations
TRIR is a lagging indicator. It measures events that have already occurred — injuries that have already harmed workers, illnesses that have already developed. This makes it useful for historical benchmarking and trend analysis, but dangerously inadequate as a standalone measure of safety performance.
I’ve worked with organizations that carried a TRIR of zero for three consecutive years, then experienced a fatal incident. Their leading indicators — near-miss reports, safety observation frequency, management safety walk participation — had been declining for eighteen months. Nobody noticed because the only metric on the executive dashboard was TRIR.
What TRIR Does Well
TRIR serves several legitimate purposes when used correctly within a broader measurement framework:
- Standardized comparison across organizations, contractors, and industry sectors — it’s the universal language of safety benchmarking.
- Trend identification over multi-year periods — a steadily rising TRIR signals deteriorating controls even when individual incidents seem unrelated.
- Regulatory compliance documentation — OSHA requires the data that feeds TRIR through the 300 log system.
- Insurance and contract qualification — TRIR remains the most commonly requested metric in pre-qualification questionnaires.
Where TRIR Falls Short
Relying on TRIR alone creates blind spots that experienced HSE managers learn to watch for:
- It rewards underreporting — organizations that discourage injury reporting or classify borderline cases as first aid show artificially low TRIRs. This is the single most corrosive effect of overemphasizing the metric.
- It ignores severity — a minor laceration requiring two sutures and a bilateral amputation carry equal weight in the TRIR calculation. One case equals one case.
- It misses near-miss signals — the hundreds of close calls and unsafe conditions that precede a recordable event are invisible to TRIR.
- Small workforce distortion — a company with 25 employees that experiences one recordable incident records a TRIR of approximately 8.0, which looks catastrophic but reflects a single event.
- It creates perverse incentives — when bonuses, contracts, and public reporting are tied exclusively to TRIR, the pressure to underreport becomes organizational rather than individual.
A zero TRIR does not mean a safe workplace. It means no recordable events were reported. The difference between those two statements is where serious injuries and fatalities hide.
Common Mistakes Organizations Make With TRIR
After a decade of auditing TRIR data across multiple industries and dozens of organizations, certain patterns repeat with uncomfortable regularity. These mistakes don’t just produce wrong numbers — they produce a false sense of security that costs lives.
The most damaging errors fall into three categories: classification manipulation, data integrity failures, and cultural distortion.
Classification and Reporting Failures
These are the tactical errors that happen at the site level, often with good intentions but harmful consequences:
- Steering injured workers to personal physicians instead of company-provided medical care to avoid documenting the treatment in the OSHA log.
- Offering light duty that doesn’t actually restrict the worker’s functions — calling it “modified duty” on paper while the employee performs identical tasks, avoiding the restricted-work classification.
- Delaying medical treatment until symptoms escalate — a strategy that doesn’t change the recordability of the original injury but delays reporting and distorts the incident date.
- Pressuring site medics to stay within first-aid boundaries — when a laceration needs sutures, prescribing Steri-Strips instead because closing the wound with adhesive strips is classified as first aid.
- Failing to record occupational illnesses — hearing loss, dermatitis, and respiratory conditions are recordable but frequently omitted because the onset is gradual and the link to work exposure isn’t immediately obvious.
Cultural and Management Distortions
These are the strategic failures that originate from leadership and cascade through the entire organization:
- Tying safety bonuses exclusively to TRIR — when a crew’s quarterly bonus depends on zero recordables, the incentive to report injuries evaporates.
- Celebrating TRIR milestones publicly while ignoring near-miss reporting rates — this signals to the workforce that not getting hurt matters more than identifying hazards.
- Treating TRIR as THE safety metric rather than one data point among many — ISO 45001 Clause 9.1.1 specifically calls for monitoring both leading and lagging indicators.
- Comparing TRIR across unlike operations without normalizing for exposure risk — comparing an office-based engineering firm’s TRIR against a demolition contractor’s rate is meaningless without context.
Pro Tip: During any safety culture assessment, I ask frontline workers one question: “If you got a minor injury today, would you report it?” The answer tells me more about the organization’s real TRIR than any spreadsheet review.
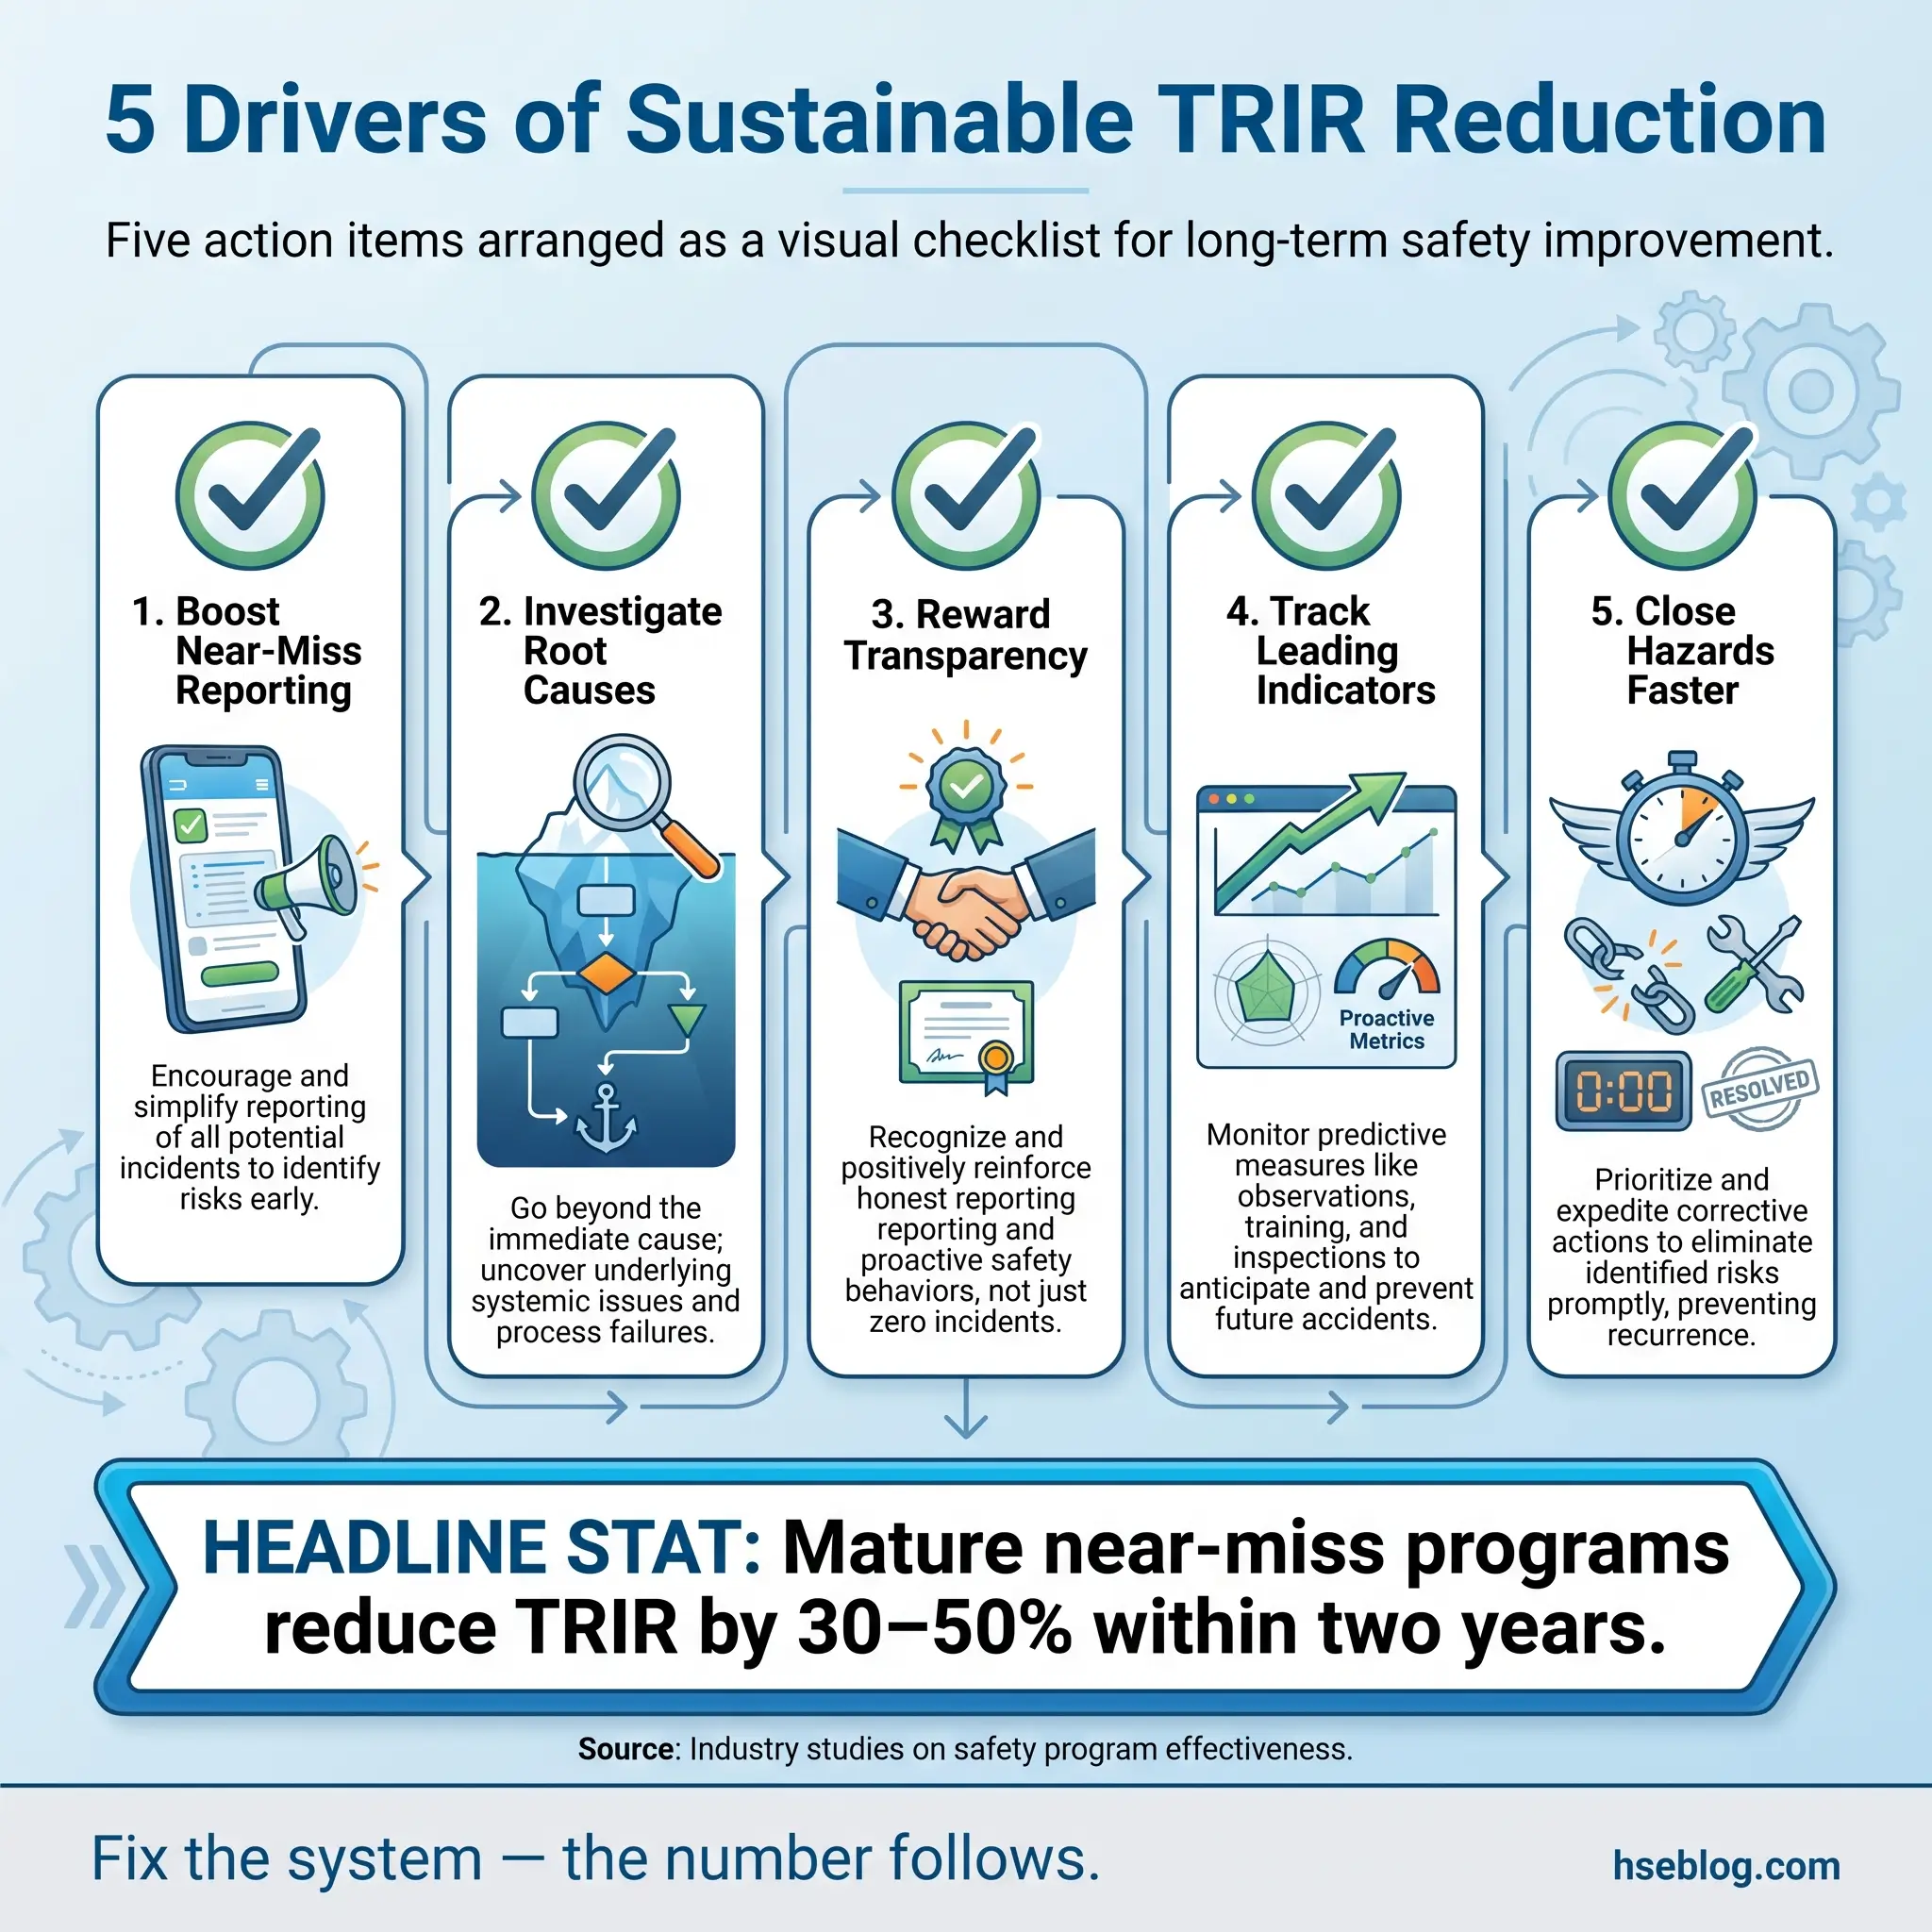
How to Reduce Total Recordable Incident Rate Effectively
Reducing TRIR sustainably — without suppressing reporting — requires addressing the conditions, behaviors, and systems that generate recordable incidents. Every organization I’ve helped lower their rate did it through upstream investment, not downstream record management.
The following strategies represent field-proven approaches that have consistently driven TRIR reductions across construction, manufacturing, oil and gas, and logistics operations.
Strengthen Leading Indicator Programs
TRIR drops when the systems that prevent incidents get stronger. Leading indicators measure the health of those prevention systems before injuries occur.
- Near-miss and good catch reporting — set targets for reporting volume rather than outcomes. A site generating 50+ near-miss reports per month is identifying and fixing hazards before they produce recordable events. Organizations with mature near-miss programs typically show TRIR reductions of 30–50% within two years.
- Safety observation frequency — track how many planned safety observations supervisors and managers complete weekly. Observation programs that include immediate corrective feedback reduce at-risk behaviors measurably.
- Hazard identification closure rate — the number of identified hazards is only half the equation. Track how fast those hazards get closed. A backlog of open hazards is a future TRIR spike.
- Pre-task risk assessment quality — audit the actual content of Job Hazard Analyses and pre-task plans. Boilerplate JHAs that haven’t been updated in years don’t prevent the specific hazards of today’s work scope.
Invest in Incident Investigation Quality
Every recordable incident is a learning opportunity. Organizations that extract maximum learning from each event prevent recurrence far more effectively than those that file the paperwork and move on.
Root cause analysis must go beyond the immediate cause. The worker slipped — that’s the event. The floor was wet — that’s the immediate cause. The drainage system was blocked because the maintenance schedule was cut during budget reductions — that’s the root cause. Effective investigation reaches the system failure, not just the physical mechanism.
Critical investigation practices that drive TRIR reduction include:
- Investigate near misses with the same rigor as actual injuries — if the outcome was luck rather than a control, the same system failure will produce a recordable event eventually.
- Track corrective action completion — an investigation that generates five recommendations but closes zero is an investigation that failed.
- Share investigation findings across all sites — incidents that happen on one site can happen on every site with similar operations. Cross-site safety alerts prevent repeat events.
- Include frontline workers in the investigation team — they understand the task conditions, time pressures, and workarounds that contributed to the event in ways that managers often don’t see from their perspective.
Build a Reporting Culture That Rewards Transparency
The most effective TRIR reduction strategy is also the hardest to implement. Organizations must create an environment where reporting injuries, near misses, and unsafe conditions is valued — not punished.
Several specific actions build this culture over time:
- Eliminate injury-based bonus structures — replace TRIR targets with leading indicator targets. Reward the number of hazards identified and corrected, not the absence of injuries.
- Implement confidential reporting mechanisms — workers who fear retaliation for reporting a minor injury won’t report hazards either. Anonymous reporting systems supplement direct reporting channels.
- Respond visibly to every report — when a worker reports a hazard and sees it corrected within 48 hours, reporting frequency increases. When reports disappear into a system with no visible action, reporting stops.
- Train supervisors on recordkeeping rules — many supervisors discourage reporting not from malice but from ignorance. They genuinely don’t understand what constitutes a recordable injury or what OSHA requires.
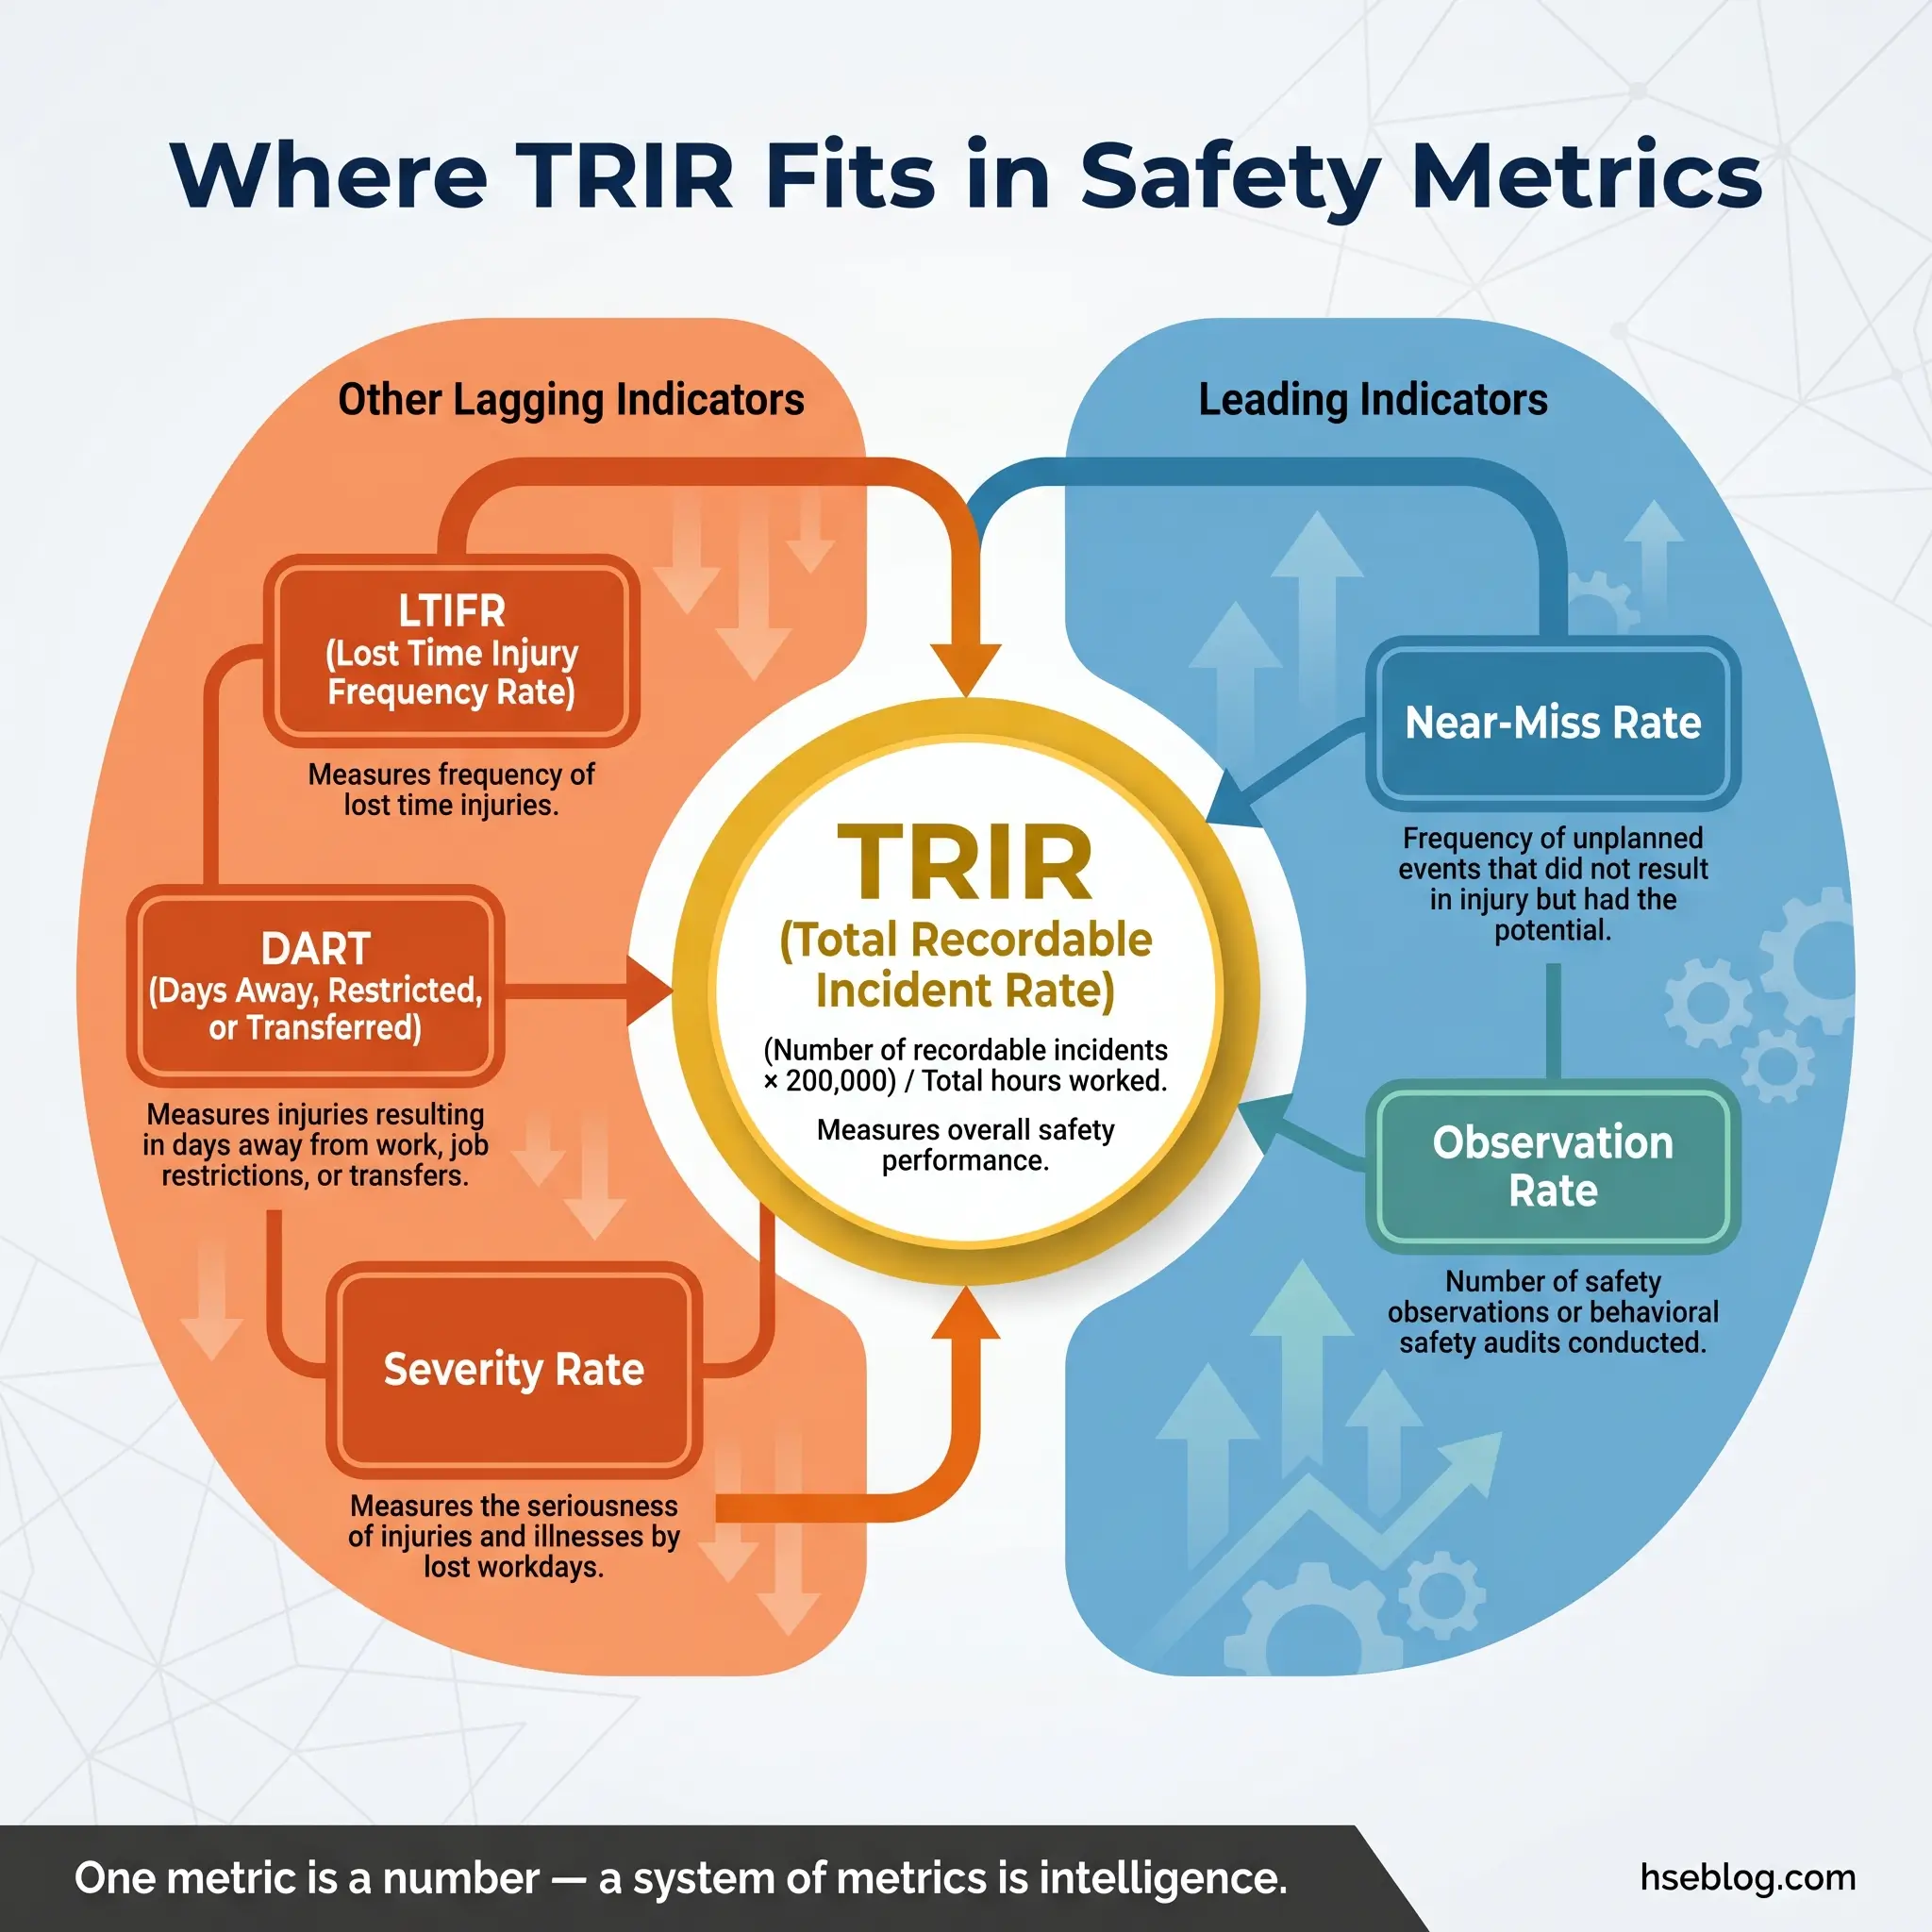
TRIR vs. Other Safety Metrics: Where Each Fits
TRIR doesn’t work in isolation. It belongs within a suite of complementary metrics, each measuring a different dimension of safety performance. Understanding where TRIR fits — and where other metrics pick up — prevents the tunnel vision that single-metric focus creates.
The following table compares the most commonly used safety performance metrics alongside TRIR:
| Metric | What It Measures | Type | Key Difference from TRIR |
|---|---|---|---|
| TRIR | All recordable incidents per 200,000 hours | Lagging | Broadest injury metric — includes all recordable cases |
| LTIFR | Lost-time injuries per 1,000,000 hours | Lagging | Only counts cases resulting in time away from work |
| DART Rate | Days away, restricted, or transferred per 200,000 hours | Lagging | Excludes medical-treatment-only cases |
| Severity Rate | Lost workdays per 200,000 hours | Lagging | Captures injury severity, not frequency |
| Near-Miss Frequency Rate | Near misses per 200,000 hours | Leading | Measures hazard identification, not injury outcomes |
| Safety Observation Rate | Planned observations per worker per month | Leading | Measures prevention activity, not events |
A balanced safety performance framework combines both leading and lagging indicators. TRIR provides the outcome data. Leading indicators provide the early warning. Together, they give a complete picture.
During management reviews under ISO 45001, I always present both dimensions side by side. When TRIR is flat but near-miss reporting is declining, the organization isn’t getting safer — it’s getting quieter. That distinction has prevented serious incidents on more than one project I’ve managed.
Conclusion
Total Recordable Incident Rate remains one of the most important metrics in occupational safety — not because it’s perfect, but because it’s universal. Every client, regulator, and insurer speaks TRIR. It provides a standardized baseline that allows organizations to benchmark performance, identify trends, and demonstrate accountability for worker welfare.
But TRIR only tells the truth when it’s fed honest data. The moment an organization starts managing the number instead of managing the hazards, the metric becomes a liability rather than a tool. I’ve watched companies achieve a zero TRIR through systematic underreporting, then suffer catastrophic events because the hazards they refused to document were the hazards they refused to address. The path to a genuinely low TRIR runs through robust near-miss reporting, rigorous incident investigation, transparent reporting cultures, and relentless attention to leading indicators.
A number on a spreadsheet never kept anyone safe. The actions behind that number — the hazard you corrected before a shift, the near miss you investigated like a lost-time event, the supervisor who encouraged a worker to report rather than hide — those are the things that bring people home. Measure your TRIR honestly, act on what it reveals, and never let a good number become an excuse to stop looking.