
TL;DR
- A risk matrix is a visual grid that ranks hazards by likelihood and severity, giving safety teams a consistent, defensible method to prioritize which risks demand immediate action and which can be managed through routine controls.
- Most site-level risk matrices fail not because the tool is flawed, but because the people filling them in aren’t trained to distinguish between likelihood categories or apply severity definitions consistently across different hazard types.
- A 5×5 matrix is the industry standard for most high-risk operations, balancing enough granularity for meaningful differentiation without creating decision paralysis — though 3×3 matrices work well for toolbox talks and task-level assessments.
- The matrix is only as good as the hazard identification that feeds it — if your HIRA process misses a hazard entirely, the most sophisticated matrix in the world won’t protect anyone.
- Risk matrices must be living documents, reassessed after every incident, near-miss, management of change, or operational shift — not laminated cards that collect dust in a site office drawer.
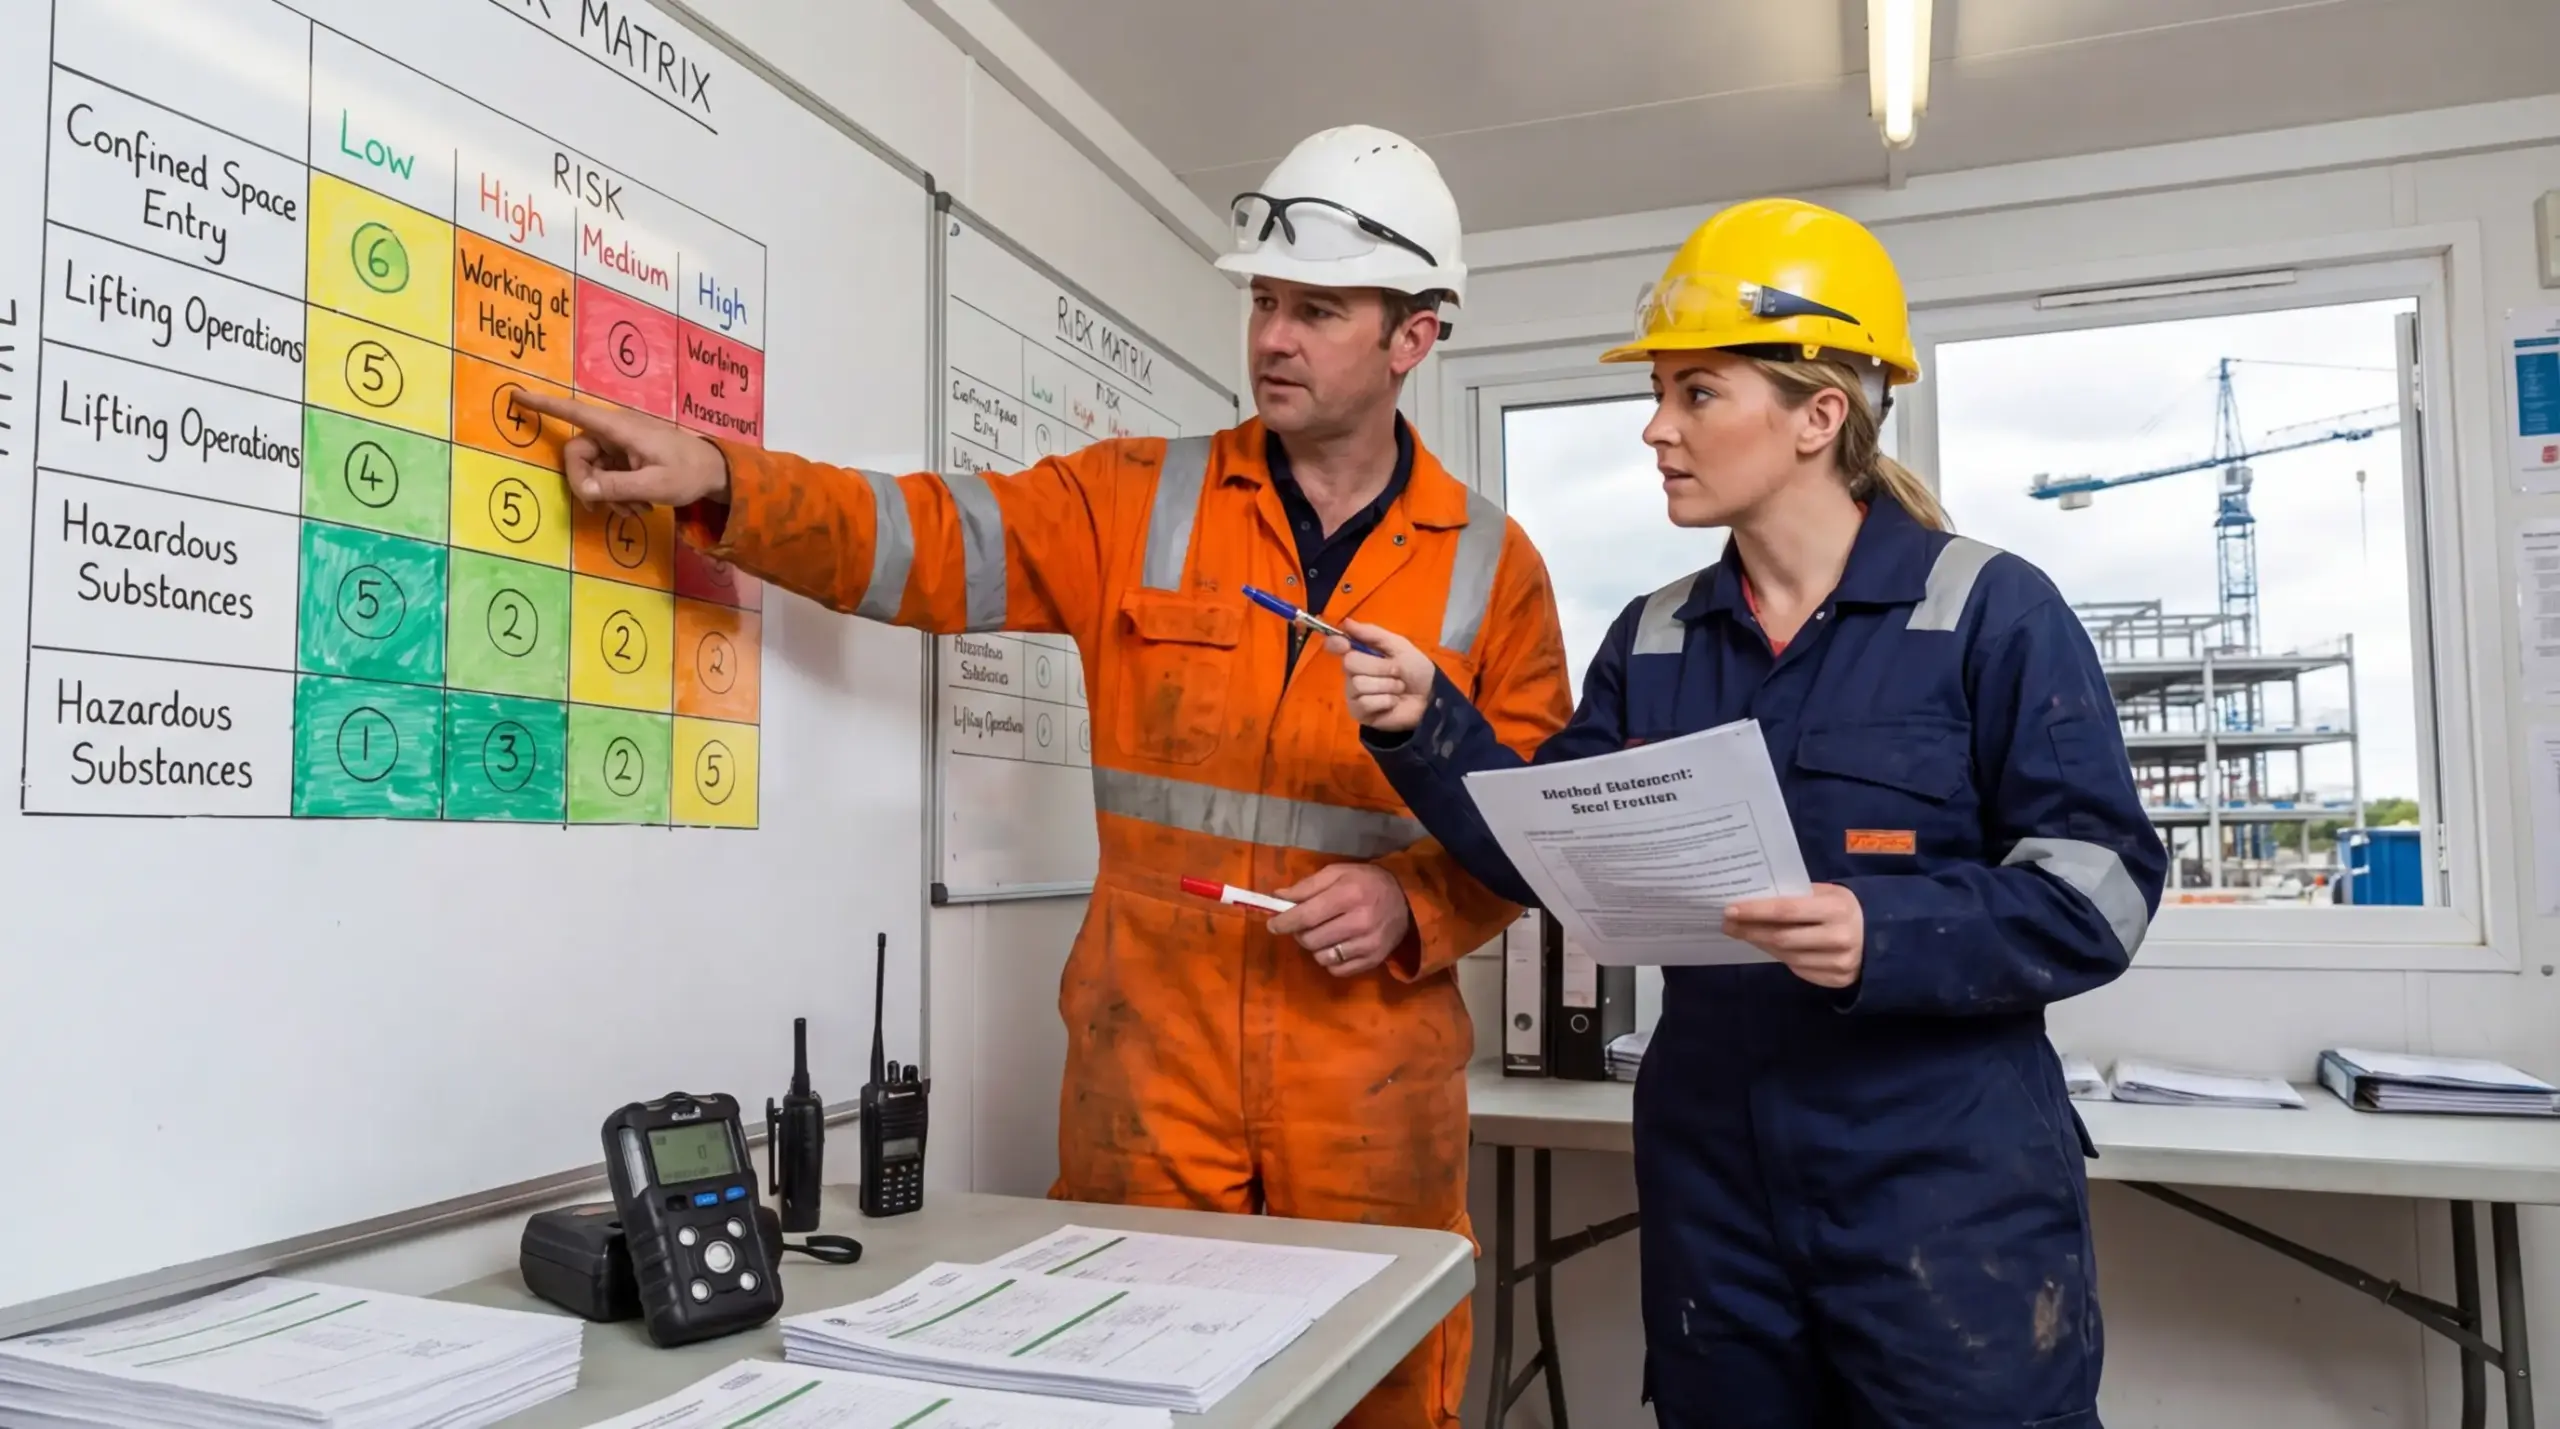
I was reviewing a contractor’s risk assessment package on a refinery turnaround in the Gulf when I pulled out their risk matrix — a clean, color-coded 5×5 grid laminated and clipped to the front of every work pack. It looked professional. Every hazard was neatly scored. Every cell was filled in. And every single risk had been rated medium. Forty-three line items covering confined space entry, hot work at height, simultaneous operations near live hydrocarbon systems — all scored identically as “medium risk.” The matrix existed, but nobody had actually used it. The contractor’s supervisors told me they’d been instructed to “fill it in” before mobilizing. Nobody had explained what the numbers meant, how to differentiate between a severity 3 and a severity 4, or what was supposed to change operationally when a risk landed in the red zone.
That experience captures exactly why this article exists. A risk matrix is one of the most widely used tools in occupational health and safety — and one of the most widely misused. When applied correctly, it transforms vague hazard discussions into structured, repeatable decisions that drive real resource allocation, control selection, and management attention. When treated as a compliance checkbox, it becomes dangerous wallpaper — giving organizations a false sense of security while critical risks hide in plain sight behind identical scores. This article breaks down what a risk matrix actually is, how to build and calibrate one that works in the field, the most common mistakes that undermine its value, and how experienced safety professionals use it to make defensible, life-protecting decisions across industries.
What Is a Risk Matrix? A Field-Level Definition
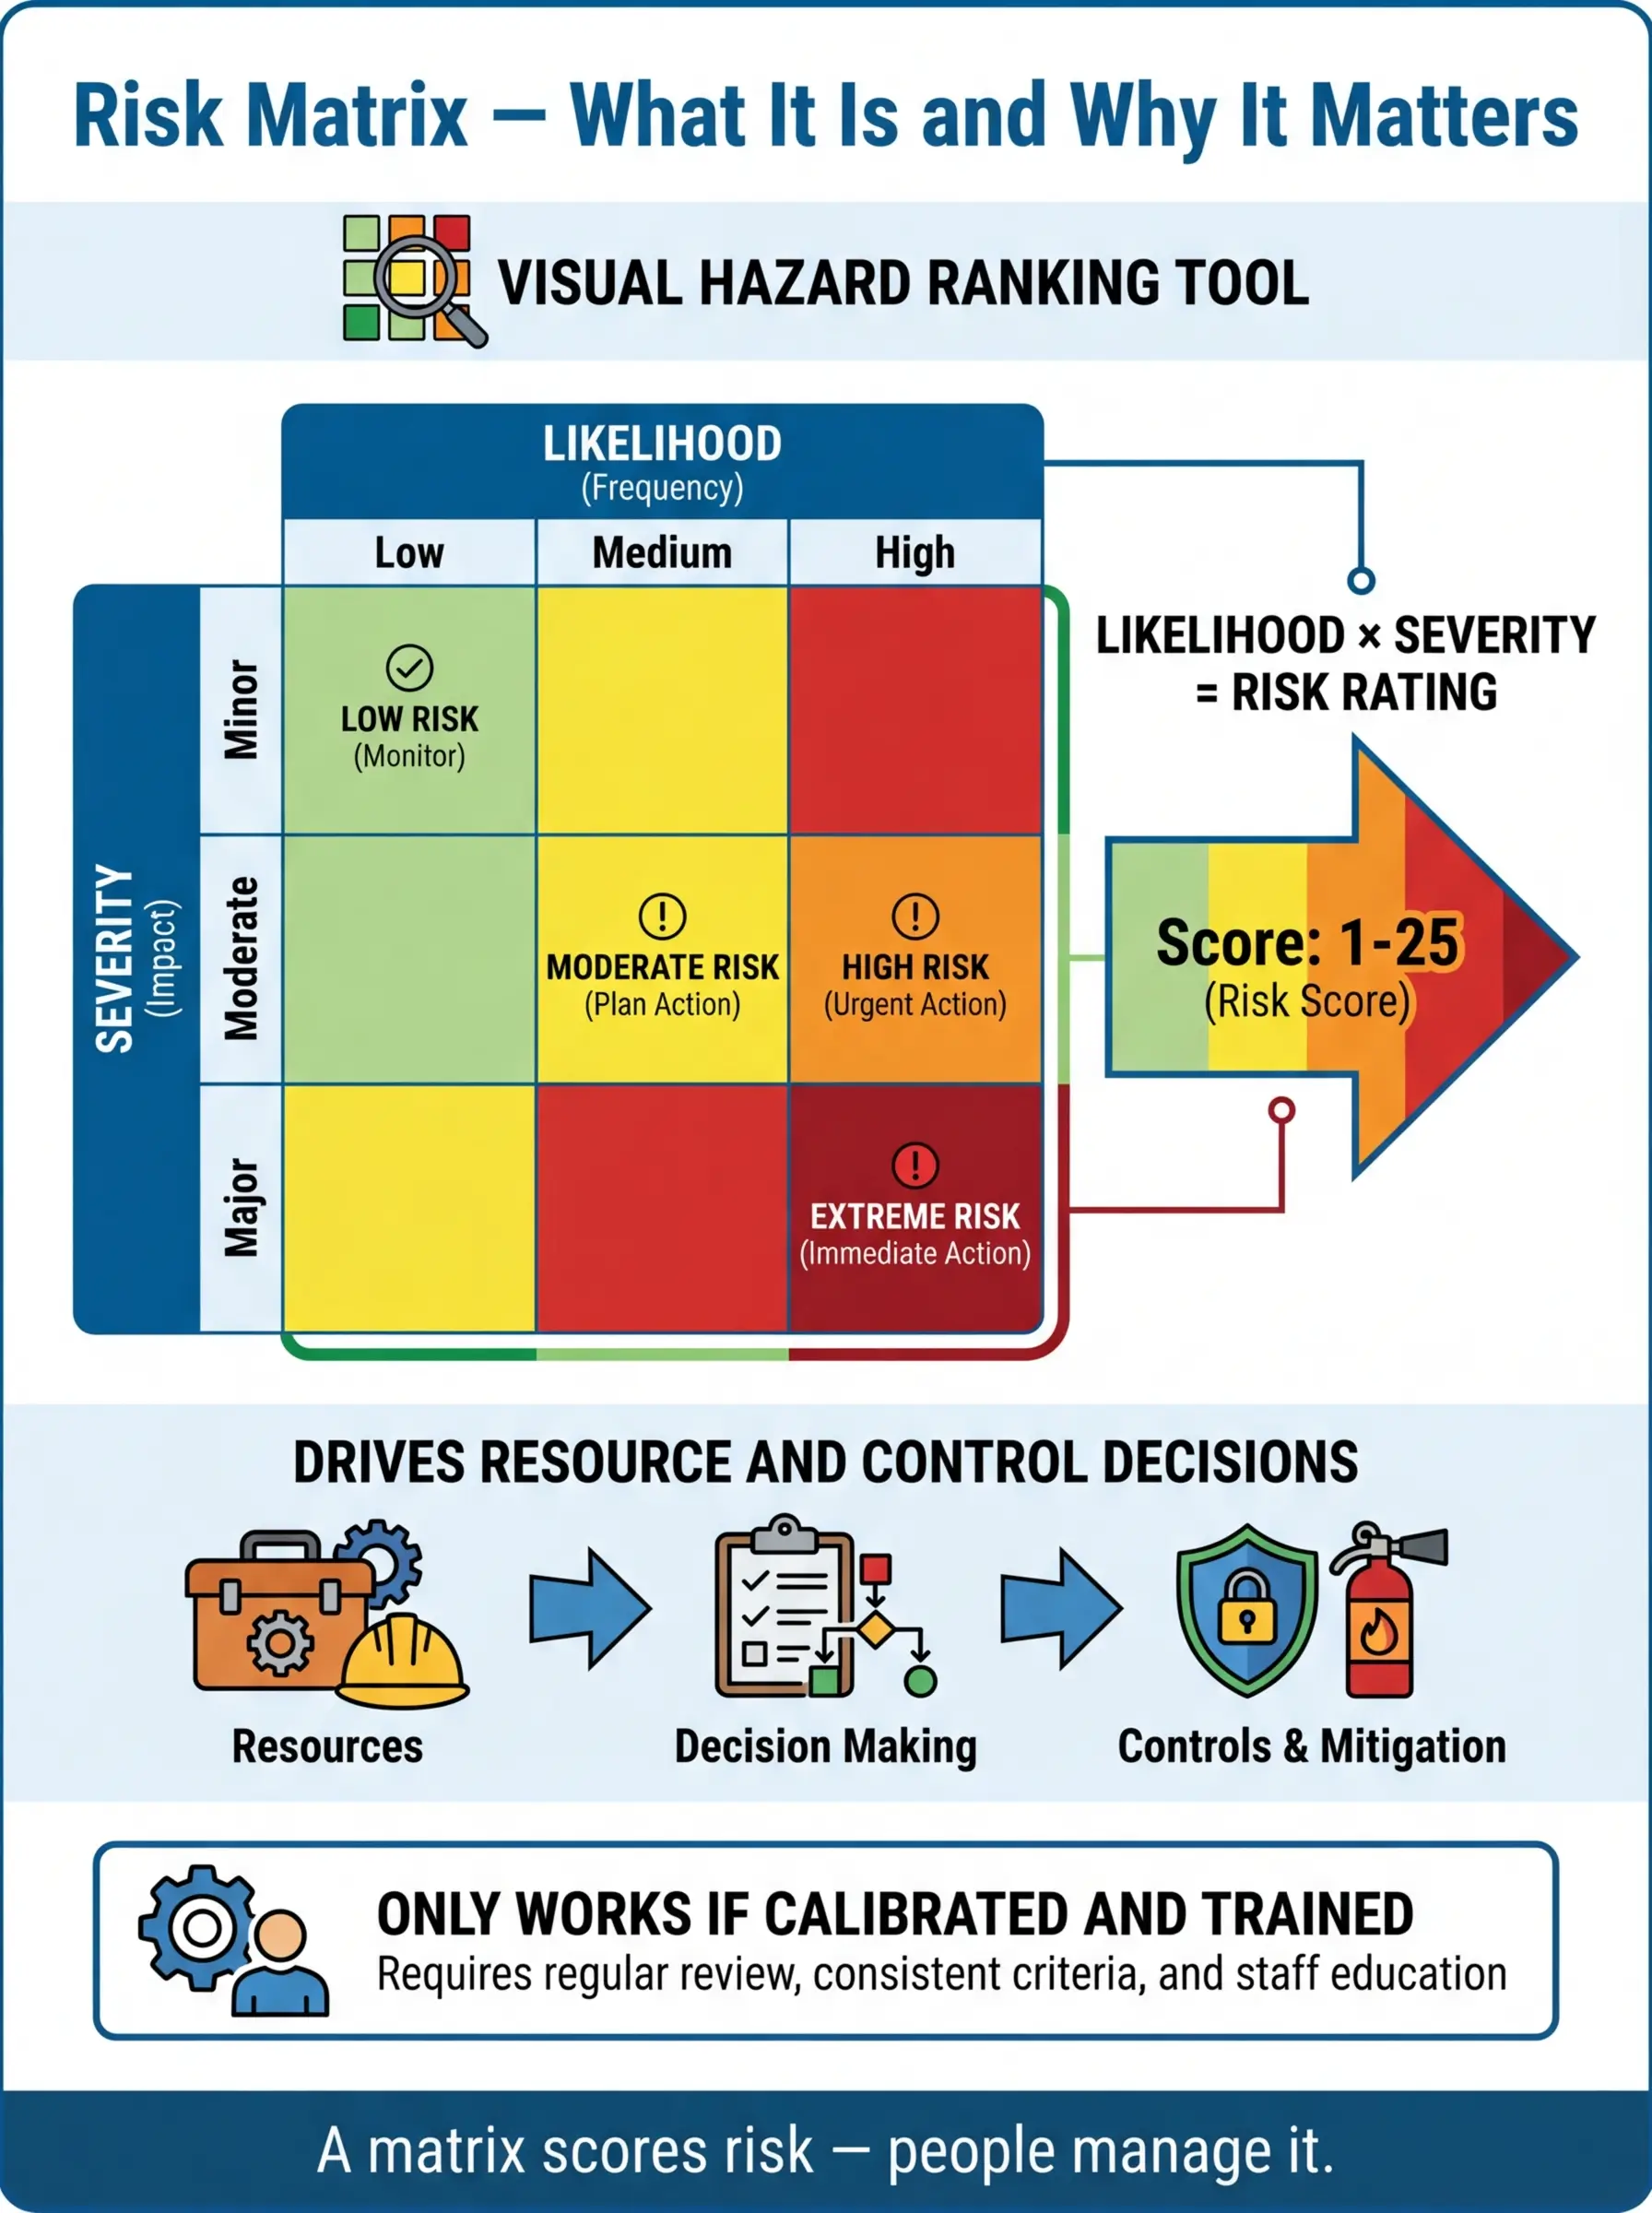
A risk matrix is a structured grid that plots the likelihood of a hazard event occurring against the severity of its potential consequences, producing a risk rating that guides decision-making. In its simplest form, it answers one question every supervisor, safety officer, and project manager faces daily: which risks need attention first?
The concept is straightforward, but the field application carries real weight. During a HIRA workshop on a mining operation in Western Australia, I watched a team of experienced operators debate for twenty minutes whether a rockfall hazard at a particular bench face was “likely” or “possible.” That debate — messy, detailed, rooted in their knowledge of the geology and blast patterns — was the matrix doing exactly what it should. It forced specificity. It demanded that people quantify their professional judgment instead of relying on gut feel.
The output of a risk matrix typically falls into one of several categories that map directly to operational decisions:
- Low risk (green zone): Manageable through routine controls and standard operating procedures. No additional resources required beyond normal supervision.
- Medium risk (yellow/amber zone): Requires documented controls, supervisor sign-off, and periodic monitoring. Work proceeds with specific precautions in place.
- High risk (orange zone): Demands senior management attention, enhanced controls, and often a formal permit-to-work or method statement review before work begins.
- Critical/extreme risk (red zone): Work stops or does not commence until risk is reduced to a lower category. Requires executive-level approval, engineered controls, and continuous monitoring.
OSHA’s General Duty Clause (Section 5(a)(1)) requires employers to provide a workplace “free from recognized hazards that are causing or are likely to cause death or serious physical harm.” A properly applied risk matrix is one of the primary tools for demonstrating that recognized hazards have been systematically evaluated and controlled — making it both an operational tool and a legal defense document.
Pro Tip: When explaining a risk matrix to frontline crews, drop the academic language entirely. I describe it as a “decision grid that tells you how worried you should be and what you need to do about it.” That framing clicks faster than any textbook definition.
The Anatomy of a 5×5 Risk Matrix
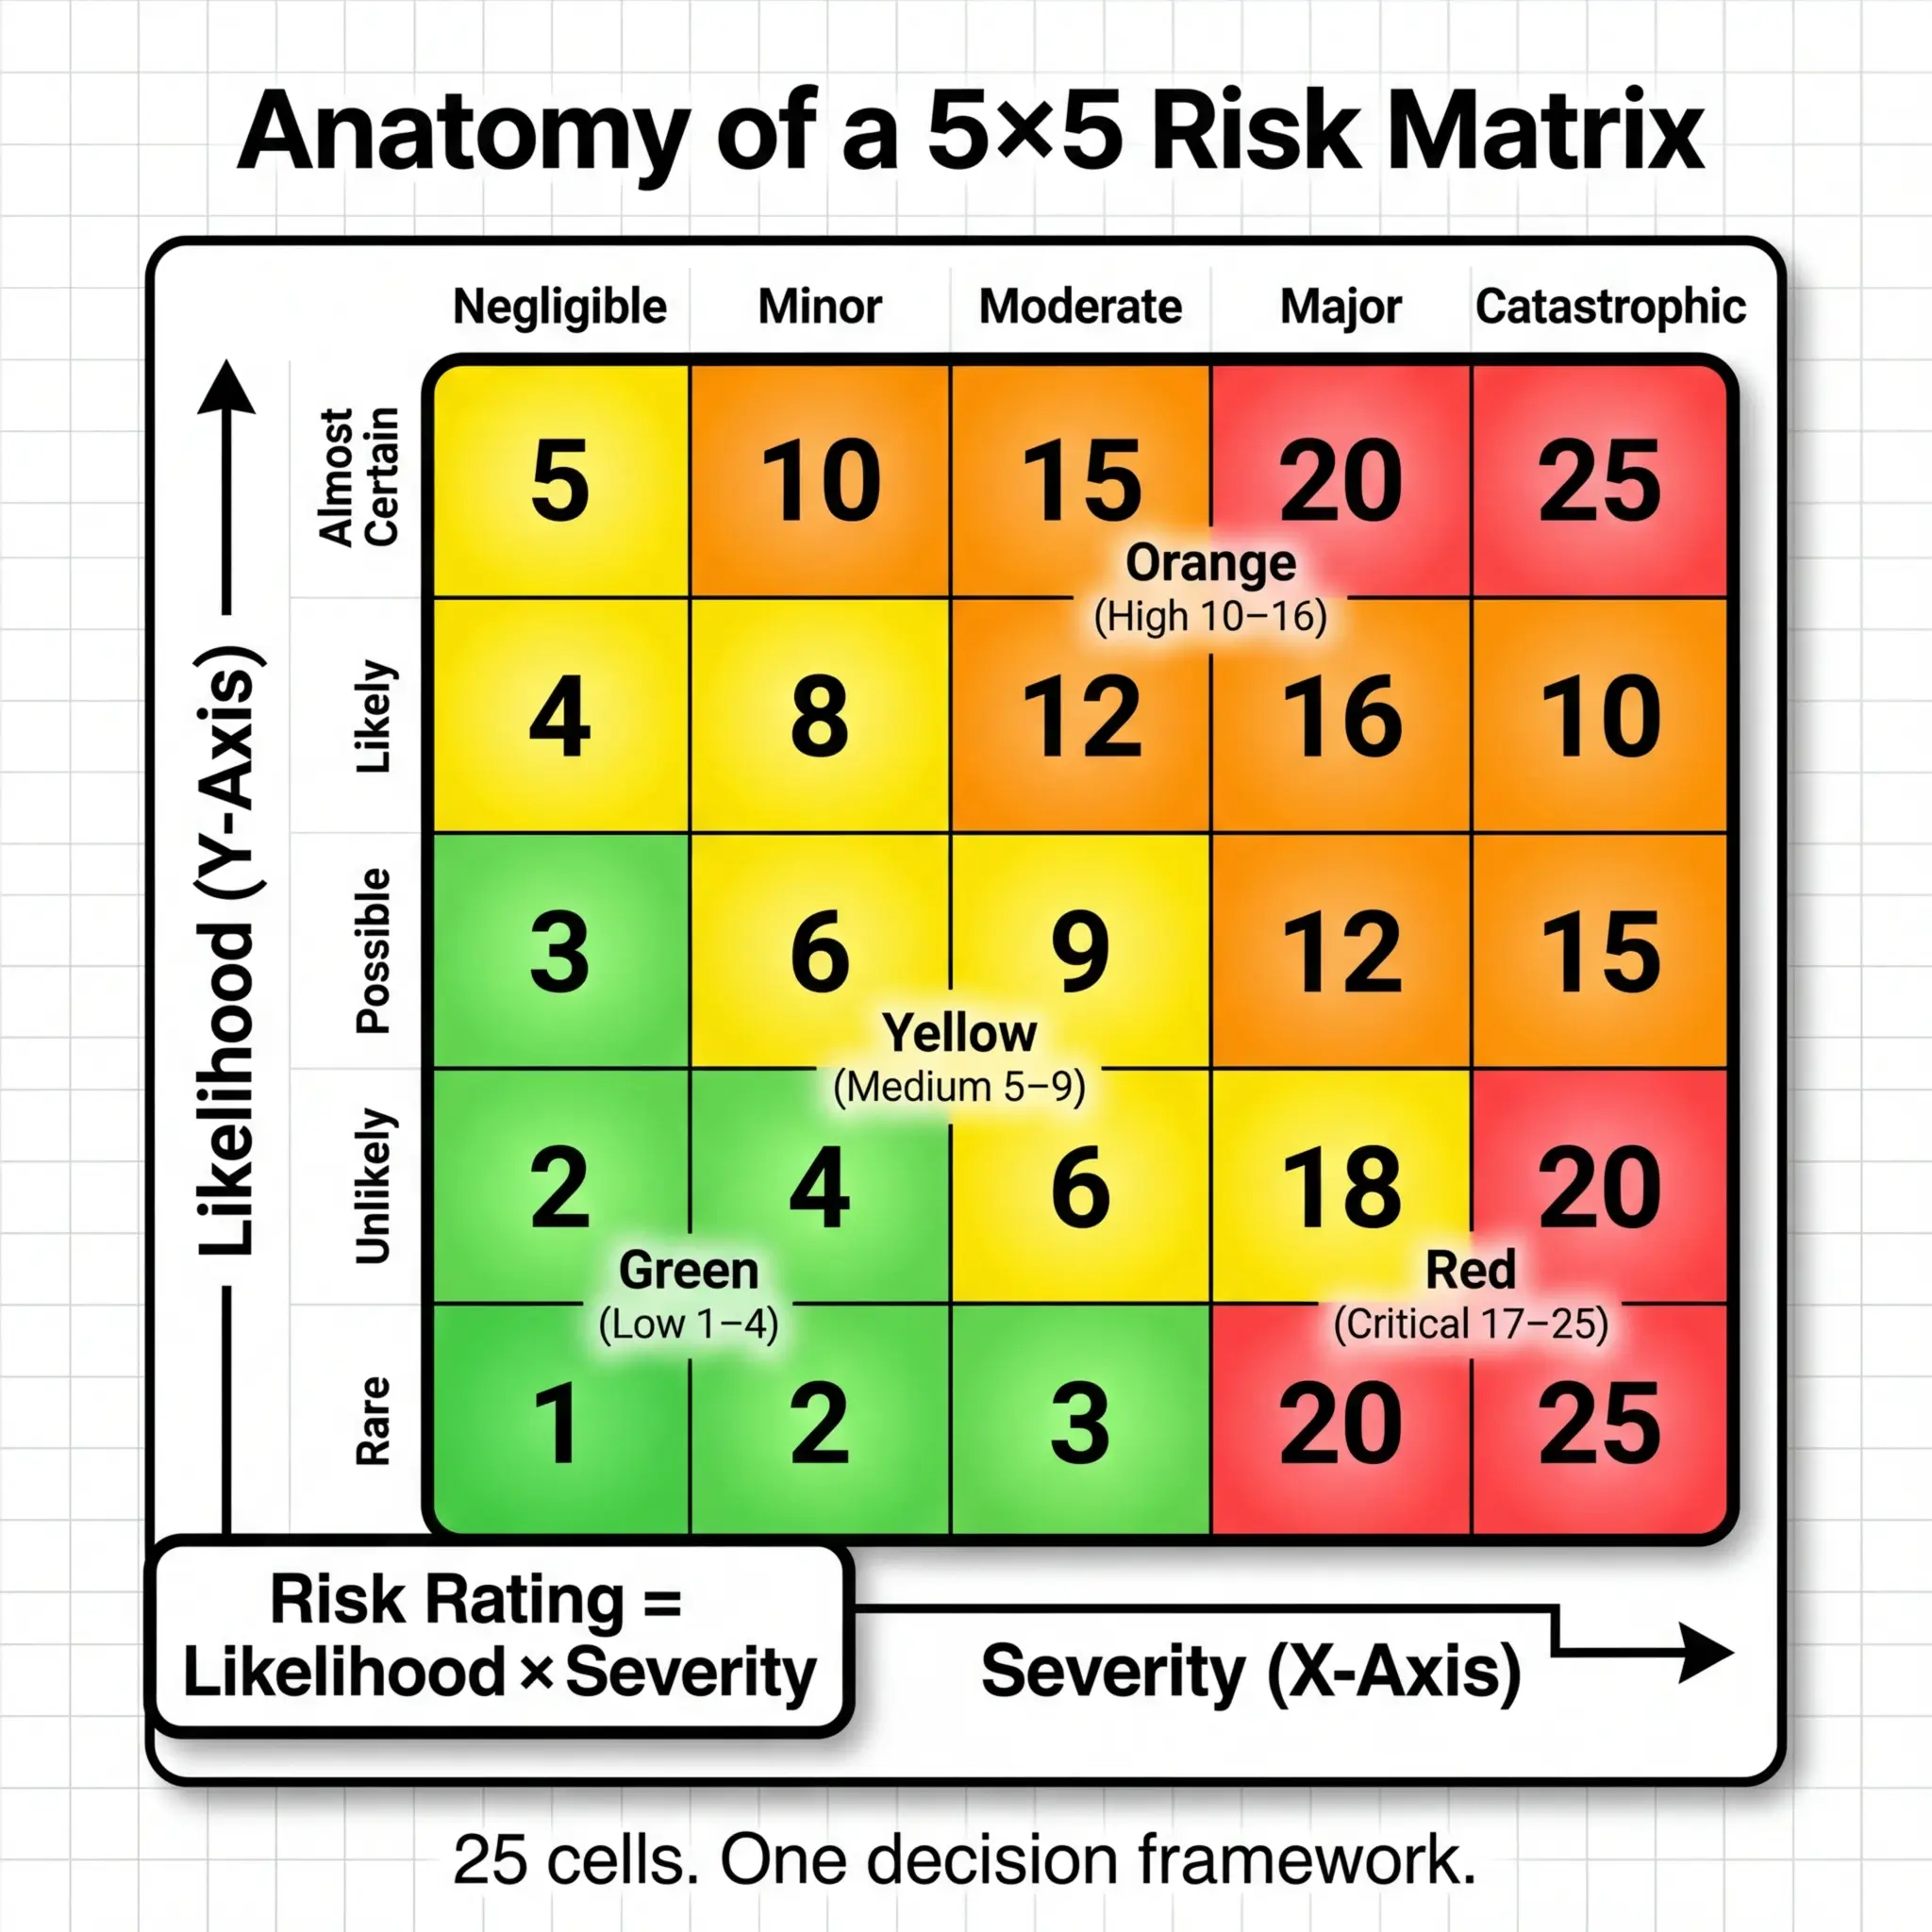
Most organizations operating in high-hazard industries — oil and gas, construction, mining, chemical processing — use a 5×5 matrix as their standard. It provides enough resolution to differentiate meaningfully between risk levels without overwhelming assessors with too many options. Understanding the structure is the foundation for using it correctly.
Likelihood Scale
The vertical axis of the matrix represents how probable it is that a hazard event will occur, given current conditions and controls. The key to a functional likelihood scale is specificity — vague labels like “unlikely” and “possible” without definitions create inconsistency across assessors and sites. Every organization should define each level with measurable criteria tied to operational experience.
A well-calibrated 5×5 likelihood scale typically uses these categories:
- 1 — Rare: Has never occurred in this operation or comparable industry operations. Conceivable only under extraordinary, multiple-failure scenarios. Frequency benchmark: less than once per 20+ years of operation.
- 2 — Unlikely: Has occurred somewhere in the industry but not at this site or under current conditions. Could happen under specific, unusual circumstances. Frequency benchmark: once per 10–20 years.
- 3 — Possible: Has occurred at this site or in similar operations under comparable conditions. Known contributing factors are present. Frequency benchmark: once per 1–10 years.
- 4 — Likely: Has occurred multiple times in this operation or is occurring regularly in similar industry operations. Contributing factors are actively present. Frequency benchmark: once per year or more frequently.
- 5 — Almost certain: Is expected to occur given current conditions, controls, and exposure levels. History of repeat occurrences. Frequency benchmark: multiple times per year or per operational cycle.
Severity Scale
The horizontal axis captures the worst credible consequence if the hazard event occurs. “Worst credible” is a critical qualifier — it does not mean the absolute worst-case theoretical outcome, nor does it mean the most common outcome. It means the worst outcome that could realistically occur given the specific scenario, environment, and exposed population.
A practical severity scale must account for multiple impact dimensions across the same rating levels:
| Severity Level | Health & Safety Impact | Environmental Impact | Business/Asset Impact |
|---|---|---|---|
| 1 — Negligible | First aid case only; no lost time | Contained on-site; no release | Minor equipment damage; < $10K |
| 2 — Minor | Medical treatment case; restricted work | Small release contained on-site | Equipment damage; $10K–$100K |
| 3 — Moderate | Lost time injury; hospitalization | Release requiring on-site remediation | Significant damage; $100K–$1M |
| 4 — Major | Permanent disability; multiple injuries | Off-site release; regulatory notification | Major asset loss; $1M–$10M |
| 5 — Catastrophic | Fatality or multiple fatalities | Major off-site environmental damage | Facility loss; > $10M |
Pro Tip: During calibration workshops, I always ask assessors: “Are you scoring the consequence of the hazard, or the consequence of the activity?” A worker climbing a ladder is an activity. The hazard is a fall from height. The severity is based on the fall — not the climbing. Mixing these up is one of the most common scoring errors I encounter on site.
How to Use a Risk Matrix: Step-by-Step Field Application
A risk matrix sitting inside a procedure manual accomplishes nothing. Its value is entirely in application — the structured conversation it forces between people who understand the work, the hazards, and the operational environment. I’ve facilitated hundreds of risk assessment workshops across industries, and the process below reflects what consistently produces defensible, operationally meaningful results.
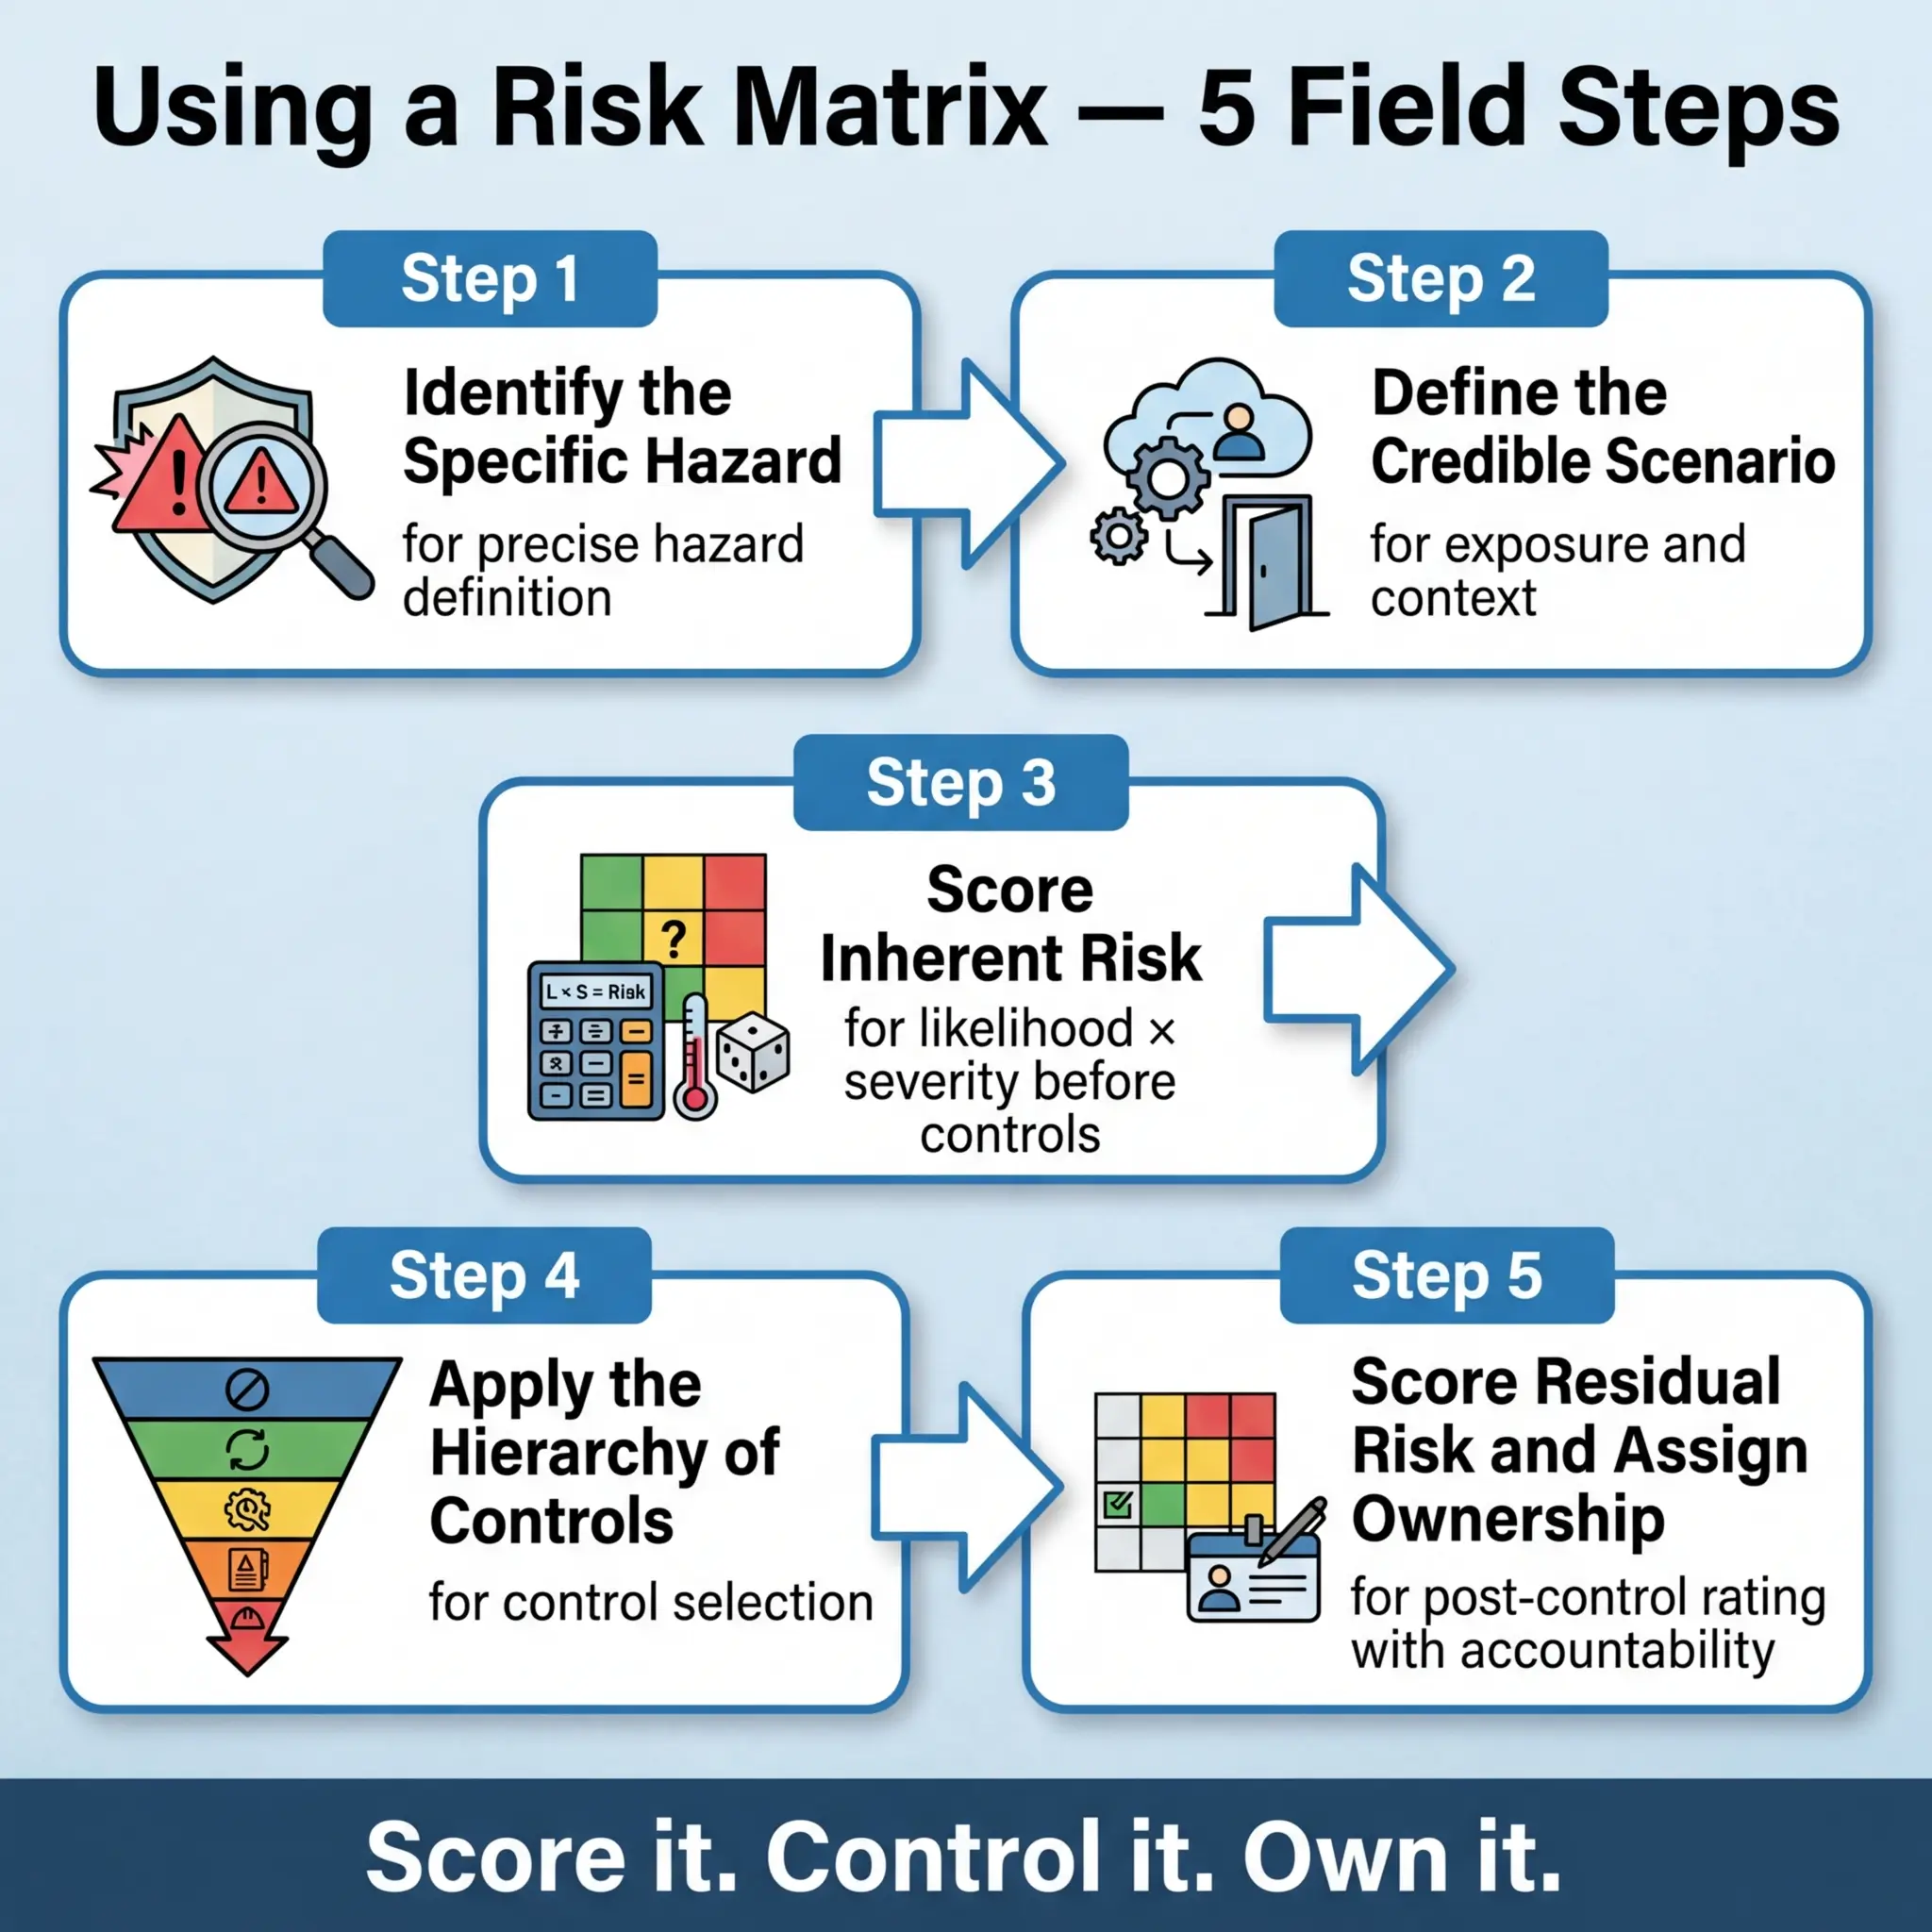
The following sequence represents the practical workflow I use on site, from hazard identification through residual risk evaluation:
- Identify the hazard clearly and specifically. “Working at height” is not a hazard — it is an activity. Fall from scaffolding due to missing guardrail on level 3″ is a hazard. Precision at this stage determines the quality of everything that follows. Use walk-downs, JSA/JHA reviews, incident history, and crew input to build the hazard register.
- Define the credible scenario. For each hazard, describe the realistic chain of events that could lead to harm. Who is exposed? Under what conditions? For how long? What existing controls (if any) are already in place? This context is essential for accurate scoring.
- Score the inherent risk (before additional controls). Using the defined likelihood and severity scales, rate the hazard assuming only existing, baseline conditions — not the controls you plan to implement. This inherent risk score tells you what you are actually dealing with and justifies the level of control investment required.
- Select and document control measures using the hierarchy of controls. Start with elimination and substitution. Move through engineering controls, administrative controls, and PPE only after higher-order controls are evaluated. Document why higher-level controls were or were not feasible — auditors and regulators will ask.
- Score the residual risk (after controls are applied). Re-rate the hazard assuming all planned controls are fully implemented and functioning. This residual score is the risk level the organization is accepting. It must fall within the organization’s risk tolerance criteria — and if it doesn’t, additional controls or escalation to senior management are required.
- Assign ownership and review dates. Every residual risk rating must have a named individual responsible for maintaining the controls and a defined review frequency. A risk score without an owner is a number on paper — not a managed risk.
ISO 45001:2018, Clause 6.1.2 requires organizations to assess OH&S risks using defined methodology, consider the effectiveness of existing controls, and determine the level of risk. The standard does not mandate a specific tool — but a well-documented risk matrix directly satisfies this clause’s intent.
Inherent Risk vs. Residual Risk: The Distinction That Changes Decisions
This is where I see the most consequential errors in field risk assessments. The failure to clearly distinguish between inherent and residual risk leads to two dangerous outcomes: either risks are underscored because assessors mentally include controls that haven’t been implemented yet, or risks are overscored because assessors ignore existing baseline protections and panic-rate everything into the red zone.
Understanding the difference is non-negotiable for anyone completing a risk matrix:
- Inherent risk is the risk level that exists before any additional controls are applied — but with baseline conditions acknowledged. If a guardrail already exists on a platform, that’s part of the inherent condition. If you’re planning to install a guardrail next week, that’s a control measure, and the inherent risk should be scored without it.
- Residual risk is the risk level remaining after all identified control measures are fully implemented, maintained, and functioning as intended. This is the risk the organization is formally accepting.
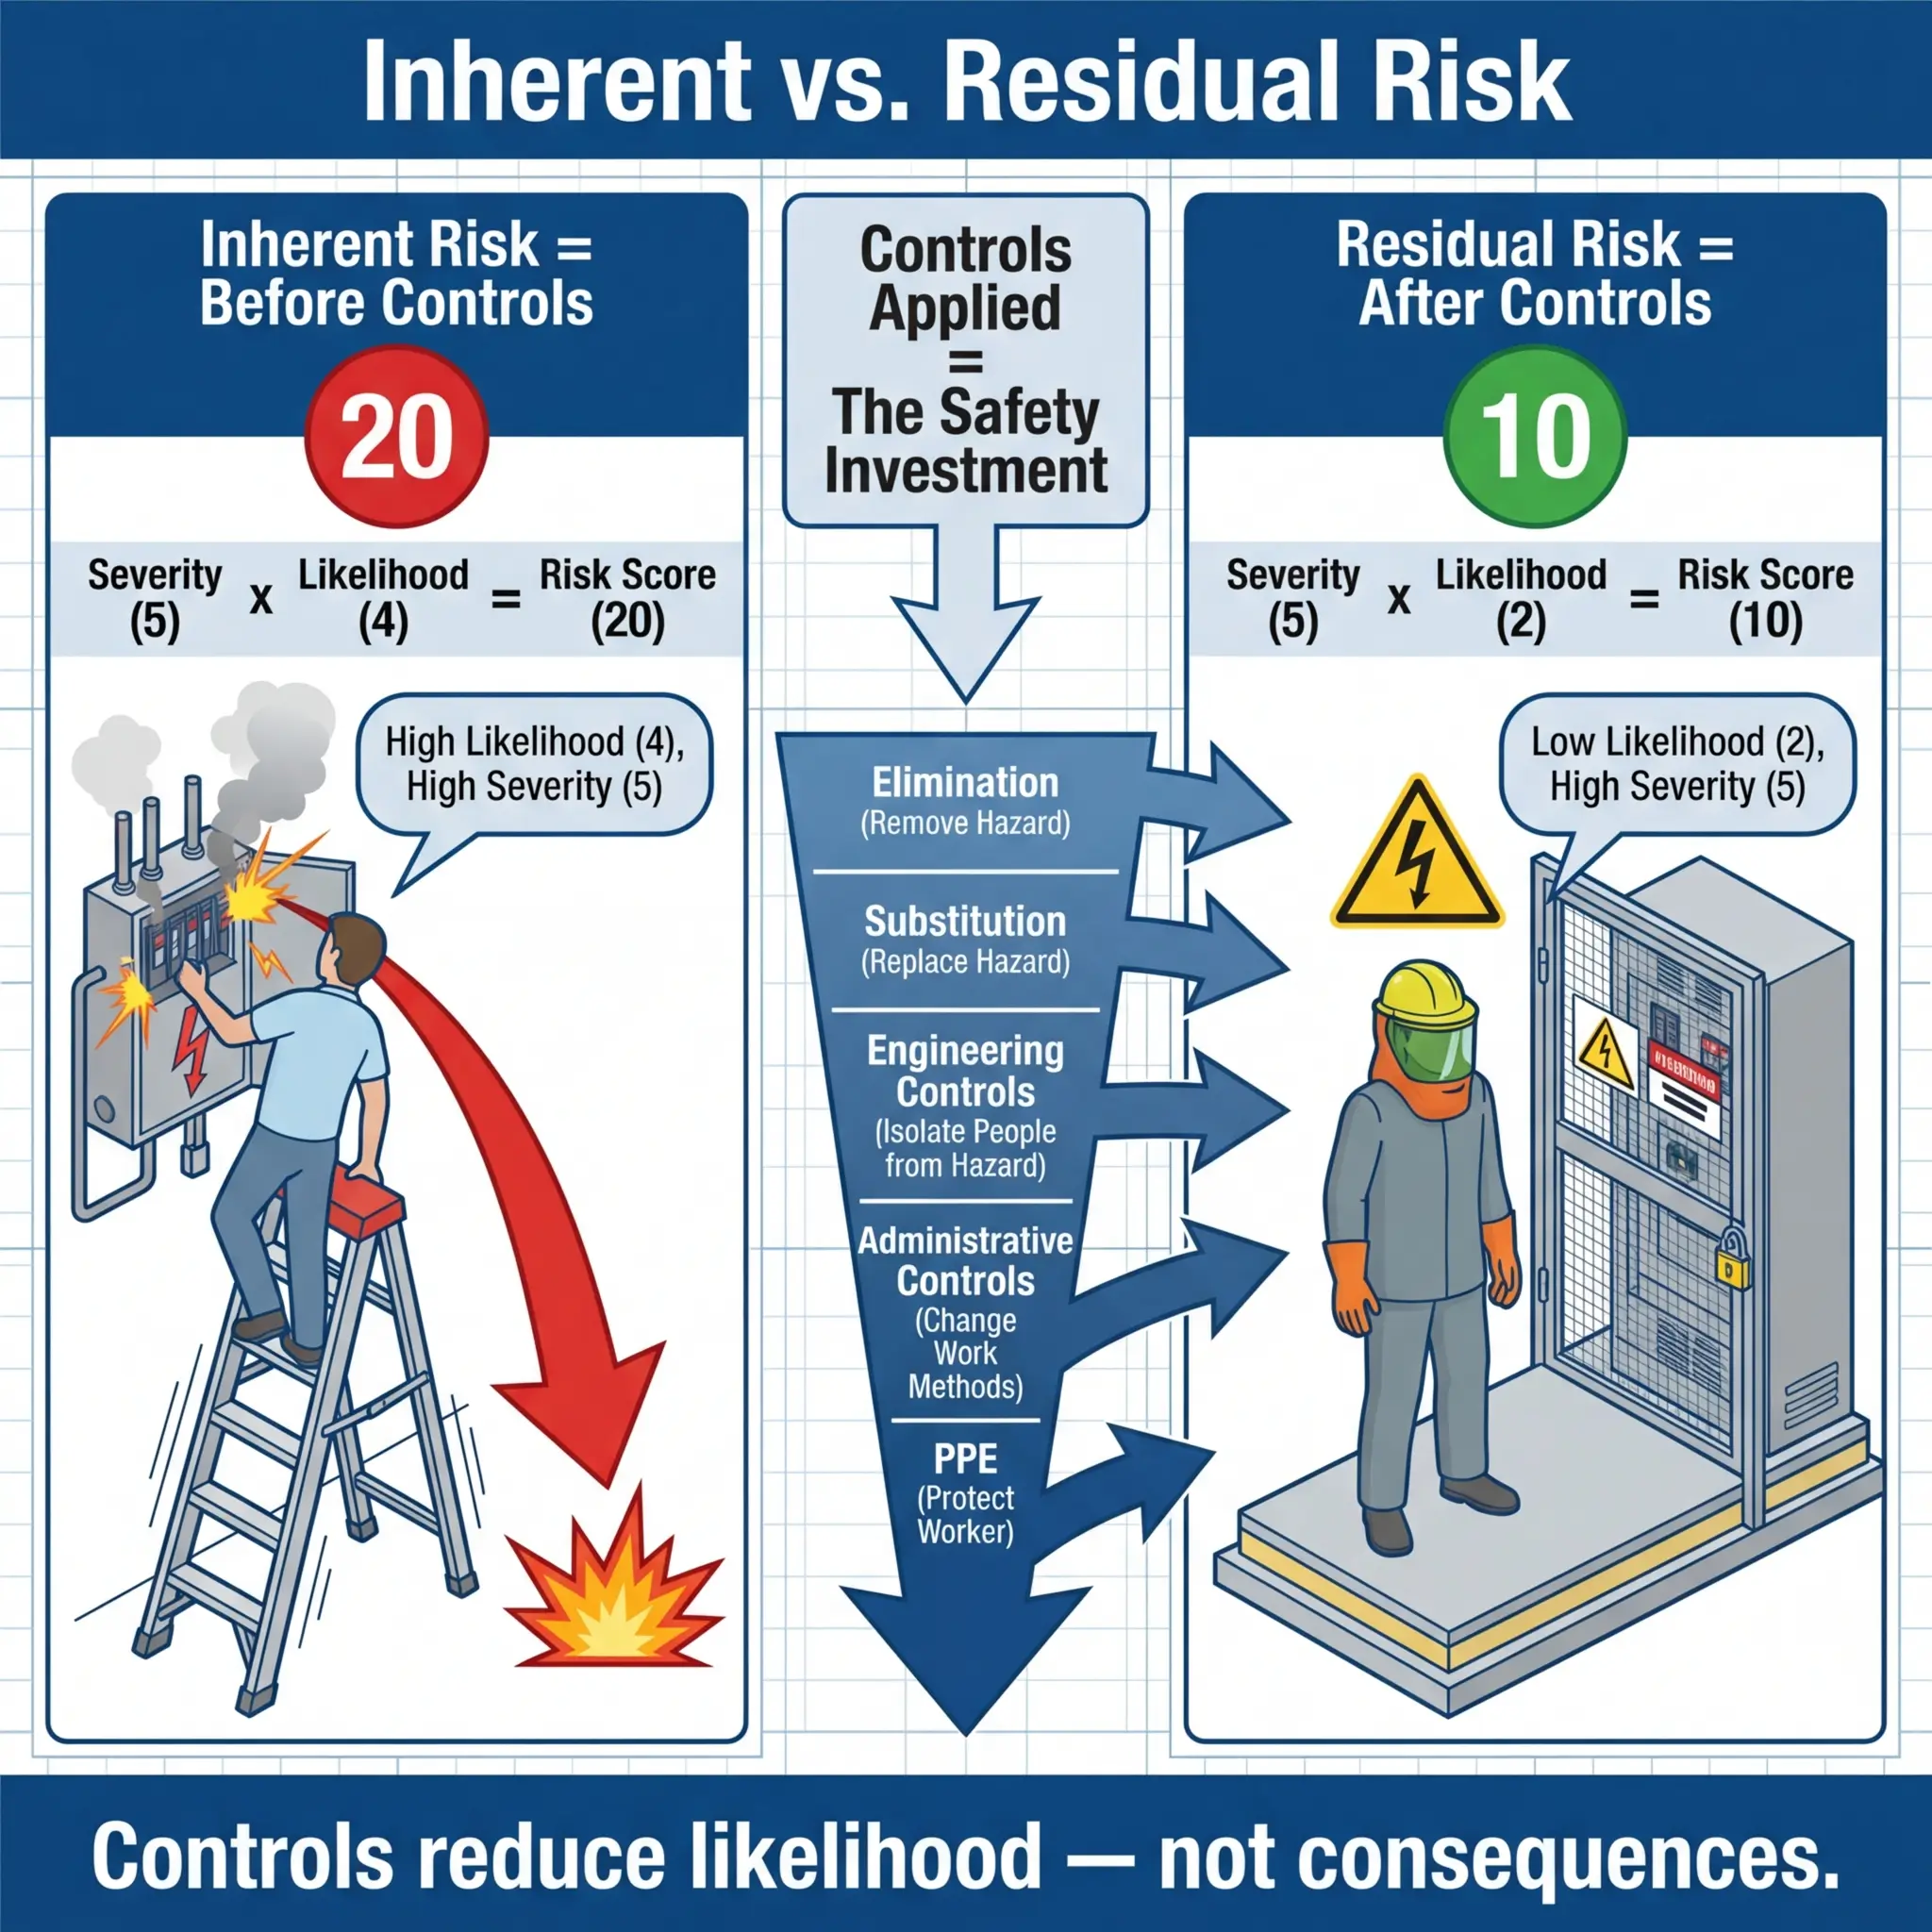
- The gap between inherent and residual risk represents the value of your controls. If your inherent risk is 20 (critical) and your residual risk is 8 (medium), those controls are doing real work. If the gap is small, your controls aren’t adequate — or you’re scoring incorrectly.
On a pipeline construction project in Central Asia, I reviewed a contractor’s risk register where every hazard showed an inherent risk of 15–20 and a residual risk of 3–4. The controls listed were generic statements like “workers will be trained” and “PPE will be provided.” A drop from critical to low risk based solely on training and PPE is not credible. When I challenged the assessment, the project team admitted they had reverse-engineered the residual scores — starting with the rating they wanted and then listing controls to justify it. That is not risk management. That is self-deception with a spreadsheet.
The following table clarifies the distinction with a practical example:
| Element | Inherent Risk Assessment | Residual Risk Assessment |
|---|---|---|
| Hazard | Fall from scaffold platform at 12m height | Same hazard |
| Existing condition | Scaffold erected, access ladder in place | Same baseline |
| Controls considered | None beyond baseline | Guardrails, toe boards, harness tie-off, competent person inspection, daily scaffold tag system |
| Likelihood score | 4 (Likely — no edge protection) | 2 (Unlikely — multiple barriers in place) |
| Severity score | 5 (Catastrophic — 12m fall) | 5 (Catastrophic — severity unchanged; fall height hasn’t changed) |
| Risk score | 20 (Critical) | 10 (High — manageable with active controls) |
Notice that severity did not change between inherent and residual. Controls reduce likelihood or mitigate consequence — but they rarely eliminate the severity potential entirely. A fall from 12 meters is still catastrophic if it happens. This is a critical teaching point: severity typically stays constant unless you physically eliminate the hazard or reduce the exposure height.
Pro Tip: I teach assessors a simple rule — “Controls bend likelihood. They rarely break severity.” If your residual severity score dropped from 5 to 2 without eliminating the hazard itself, challenge the logic. Something is wrong with the scoring.
Common Mistakes That Undermine Risk Matrix Effectiveness
Over a decade of auditing risk assessments across construction, oil and gas, mining, and manufacturing, I’ve catalogued the same failure patterns appearing with striking consistency. The risk matrix as a tool isn’t the problem — it’s a simple, effective framework. The failures are human, organizational, and systemic. Recognizing these patterns is the first step toward fixing them.
The following mistakes represent the most frequent and most dangerous errors I encounter in field risk assessments:
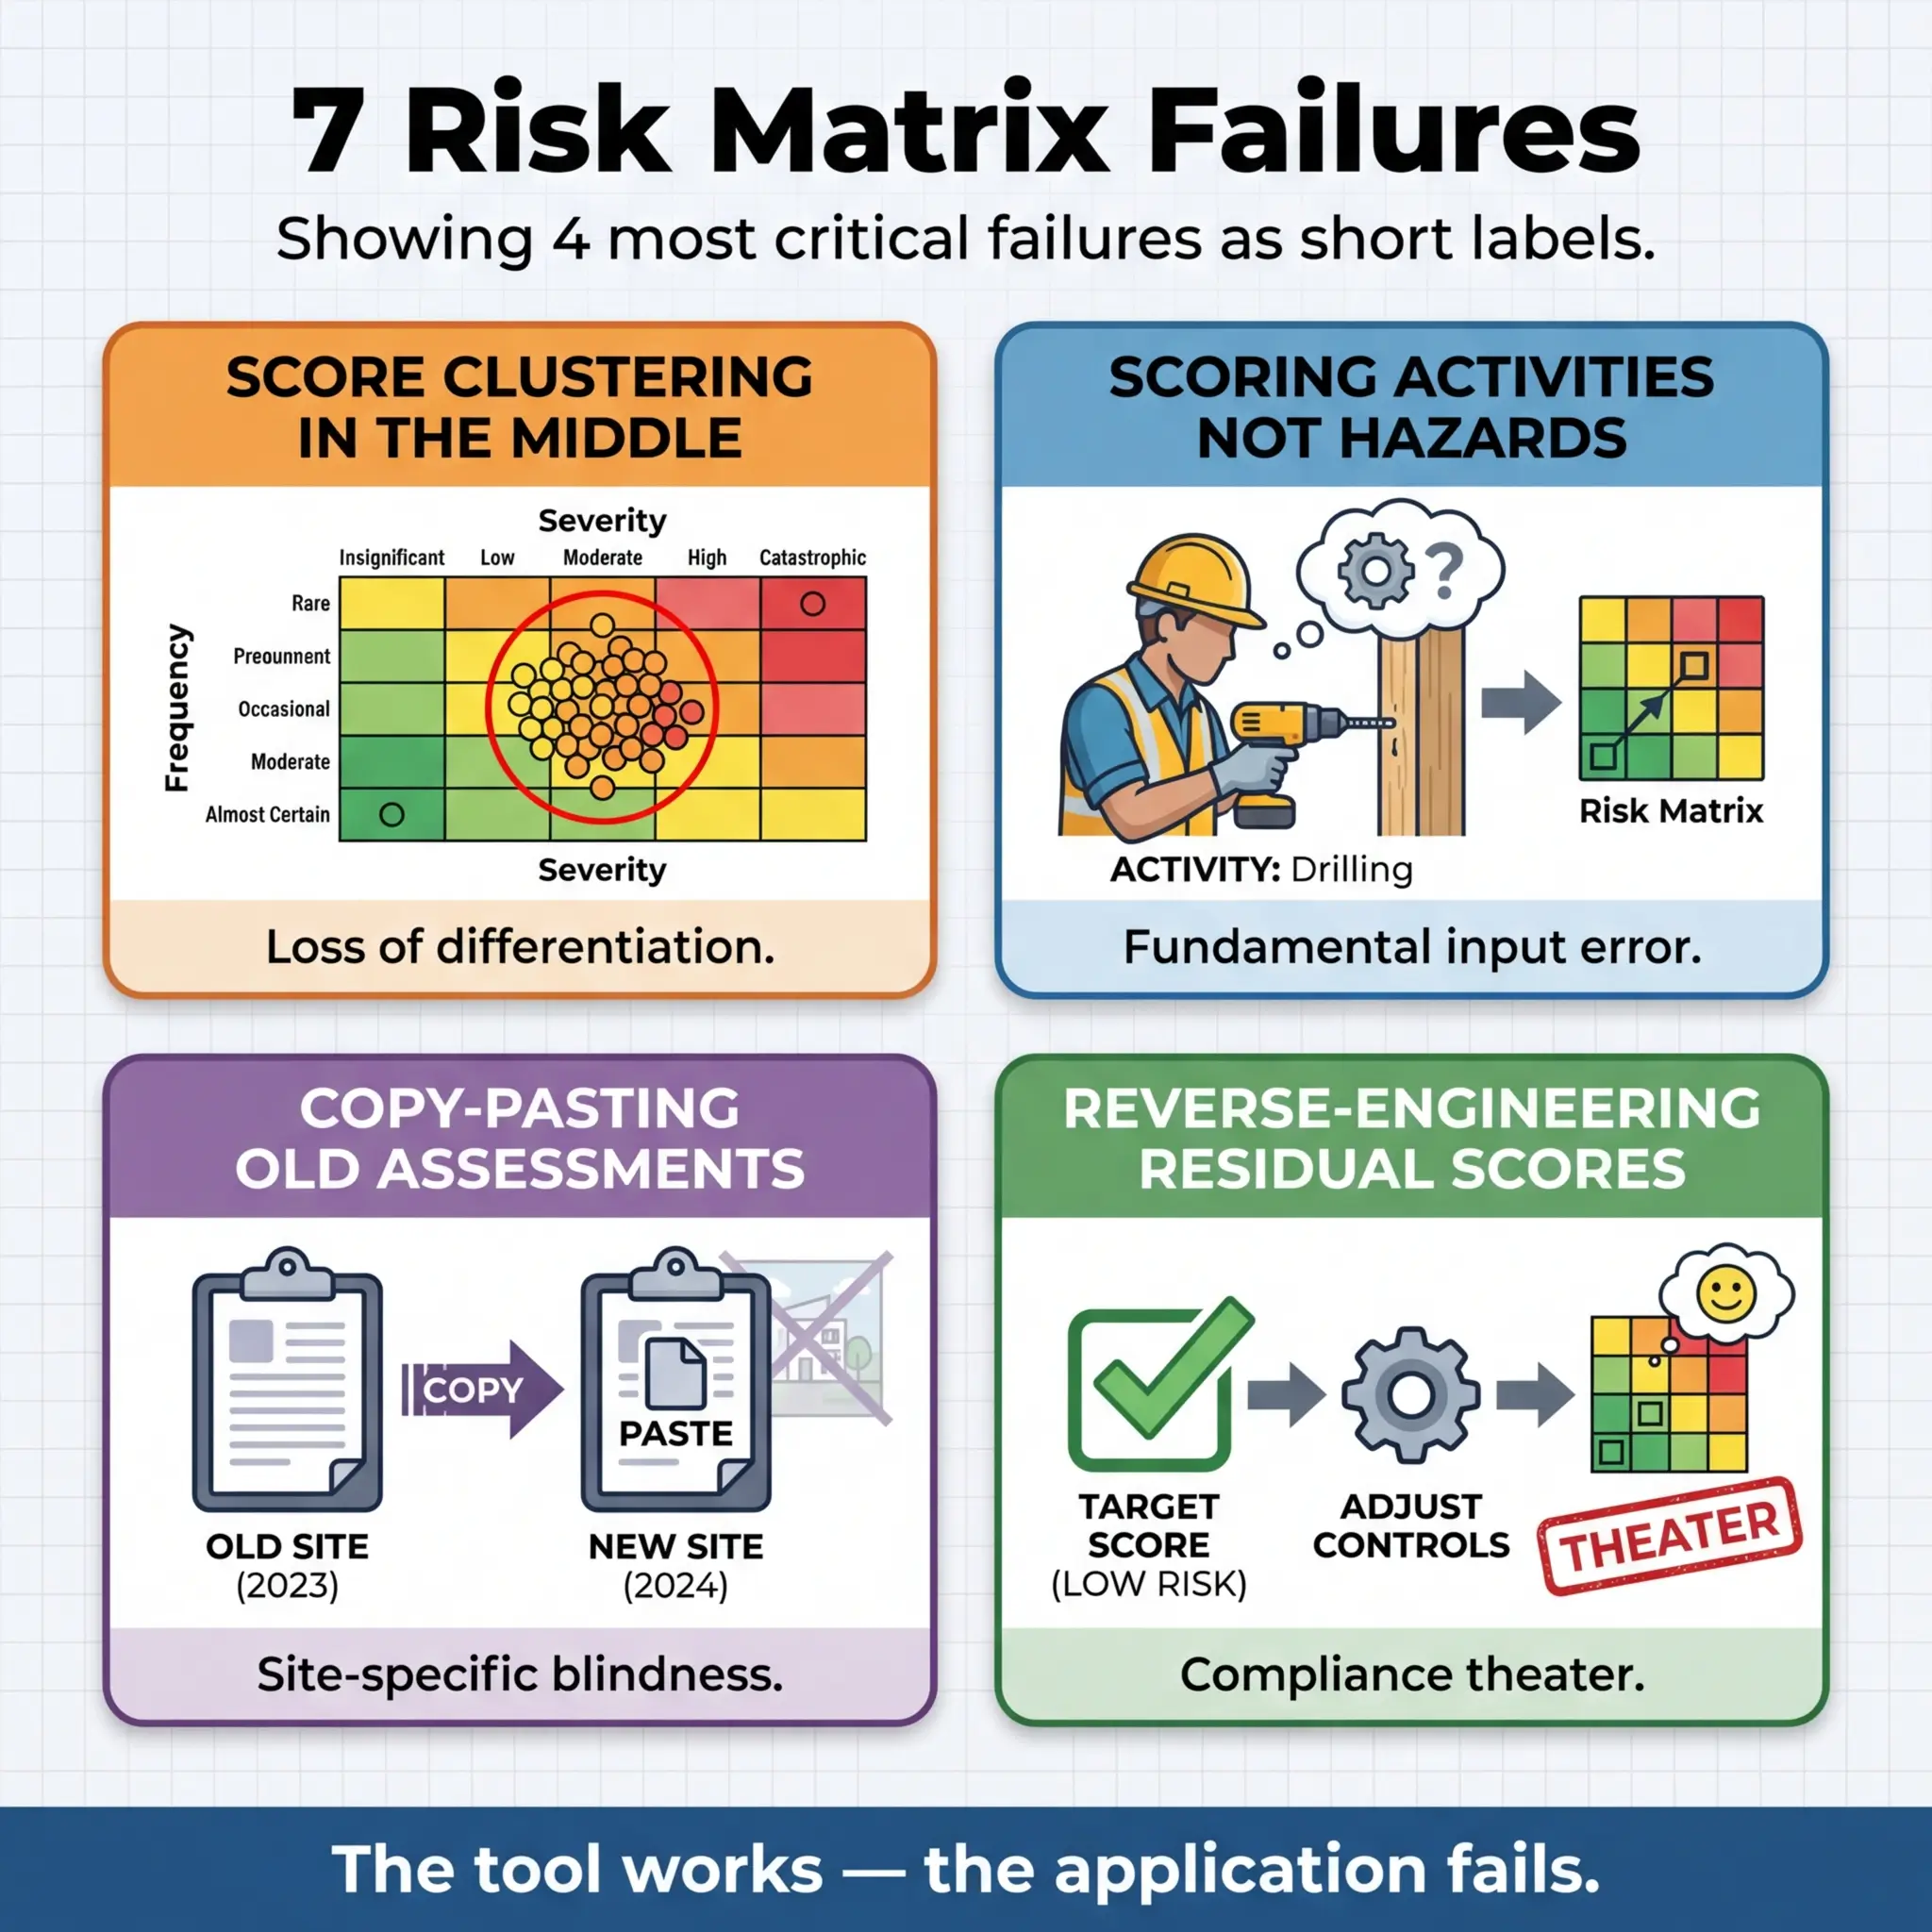
- Clustering all scores in the middle zone. This is the single most common failure. When every hazard scores 8–12 on a 25-point scale, the matrix loses its entire purpose — differentiation. Middle-clustering usually indicates that assessors lack confidence in the scoring criteria, fear accountability for high scores, or haven’t been trained to use the defined scales.
- Scoring the activity instead of the hazard. “Grinding” is an activity. “Eye injury from projected metal fragment during grinding” is a hazard. Scoring the activity produces meaningless results because a single activity can contain multiple hazards with vastly different severity and likelihood profiles.
- Copy-pasting risk assessments from previous projects. Every site, scope, and workforce is different. A risk assessment from a similar project two years ago might be a useful reference — but it cannot be your risk assessment. The conditions, competencies, equipment age, and concurrent activities are never identical. I’ve seen excavation risk assessments copied from flat desert sites applied unchanged to hillside urban excavations near live utilities. The matrix scores were fiction.
- Reverse-engineering residual risk scores. Starting with the “acceptable” score and then listing controls to justify it. This produces risk registers that look compliant on paper but reflect zero actual risk analysis. The controls listed are often generic and unverifiable.
- Ignoring severity persistence after controls. Dropping severity scores through controls that only address likelihood. A confined space with a toxic atmosphere is still severity 5 even with ventilation, gas monitoring, and rescue standby — because if those controls fail simultaneously, the consequence hasn’t changed.
- Single-person risk assessments with no field validation. A safety officer completing the risk matrix alone in an office, without input from the crew performing the work, produces an academic exercise disconnected from operational reality. The workers know where the real risks are — they live with them daily.
- Set-and-forget risk registers. Risk assessments completed at project mobilization and never updated through the project lifecycle. Conditions change — weather, scope changes, concurrent activities, workforce fatigue, equipment degradation. The risk matrix must be a living document or it becomes a historical artifact.
HSE UK’s guidance on risk assessment (INDG163) emphasizes that risk assessment “is not about creating huge amounts of paperwork, but rather about identifying sensible measures to control the risks in your workplace.” When a risk matrix becomes a compliance document rather than a decision tool, it has failed its fundamental purpose.
Choosing the Right Matrix Size for Your Operation
Not every operation needs a 5×5 matrix, and using the wrong size creates either false precision or insufficient resolution. The choice depends on the complexity of the hazards, the competency of the assessors, the regulatory expectations, and where in the assessment process the matrix is being applied.
During a consulting engagement for an international EPC contractor, I helped redesign their risk assessment framework after discovering that field supervisors were using a 6×6 matrix with 36 cells — and nobody could consistently explain the difference between “improbable” and “remote” on the likelihood scale, or between “significant” and “major” on the severity scale. The matrix was too granular for the people using it. We simplified to a 5×5 with clearer definitions, and scoring consistency improved measurably within two project cycles.
The following comparison highlights when each matrix size adds value:
| Matrix Size | Best Application | Strengths | Limitations |
|---|---|---|---|
| 3×3 (9 cells) | Toolbox talks, task-level JSAs, quick field assessments, low-complexity operations | Simple, fast, easy for frontline workers to use without training, fits on a permit card | Low resolution — struggles to differentiate between moderate hazards. Not suitable for complex or multi-hazard environments |
| 4×4 (16 cells) | Medium-complexity operations, routine maintenance, facility-level assessments | Good balance of simplicity and resolution. Suitable for experienced supervisors | Less common in international standards — can create alignment challenges with clients using 5×5 |
| 5×5 (25 cells) | High-hazard industries (oil & gas, mining, construction), project-level HIRA, regulatory submissions, management of change assessments | Industry standard resolution. Sufficient differentiation for complex hazard profiles. Aligns with most international frameworks (ISO 31000, IFC) | Requires trained assessors and clearly defined scale criteria. Can produce inconsistent results if definitions are vague |
| 6×6 or larger | Specialized quantitative risk assessments (QRA), process safety studies, HAZOP follow-up | Very high resolution for specialist applications | Too complex for routine field use. Assessors cannot reliably distinguish between adjacent categories. Creates false precision |
The governing principle is this: the matrix must match the competency of its users and the complexity of the decisions it supports. A perfect 5×5 matrix used badly is worse than a simple 3×3 used well.
Calibrating Your Risk Matrix: The Step Most Organizations Skip
A risk matrix without calibration is a subjective opinion generator. Calibration is the process of aligning all users of the matrix to a common understanding of what each likelihood and severity level means in their specific operational context. Without it, two equally competent assessors evaluating the same hazard on the same site can produce wildly different scores — and both believe they are correct.
I run calibration workshops at the start of every major project and after any significant change in workforce composition. The process is straightforward but demands facilitated discussion, not a PowerPoint lecture.
The calibration process I use on site follows this sequence:
- Present 8–10 real hazard scenarios relevant to the project scope. These should range from low to critical risk and cover different hazard categories (falls, chemical exposure, struck-by, confined space, electrical). Use scenarios from the actual project site or industry — never abstract examples.
- Have each participant score every scenario independently. No discussion, no collaboration. Collect the scores anonymously if possible. This reveals the actual spread in interpretation.
- Display the results and identify the divergence points. If scenario 4 produces scores ranging from 6 to 20, that tells you the team has no shared understanding of that hazard’s likelihood or severity. This is the most valuable moment in the entire workshop — it makes the problem visible.
- Facilitate structured discussion on each divergent scenario. Walk through the definitions together. Ask each outlier scorer to explain their reasoning. Adjust definitions if they are genuinely ambiguous. Achieve consensus — not by averaging scores, but by clarifying criteria until assessors can apply them consistently.
- Document the calibrated definitions and agreed scores as the project baseline. These become the reference standard for all subsequent risk assessments on the project.
On a tunnel construction project in Southeast Asia, calibration revealed that the client’s engineers consistently scored ground collapse as “unlikely” based on geological survey data, while the contractor’s supervisors scored it as “almost certain” based on their experience with similar ground conditions on previous projects. Both groups had valid reasoning — but they were using different evidence bases. The calibration workshop produced an agreed likelihood score of “possible” with a trigger clause: if any ground monitoring readings exceeded threshold values, the score would automatically escalate to “likely” and trigger additional controls. That kind of adaptive scoring only emerges from proper calibration.
Pro Tip: Never calibrate using hypothetical scenarios. Use real incidents from your industry or project. People engage differently when they know the scenario actually happened — the scoring becomes more deliberate and the discussions more honest.
Risk Matrices in Practice: Integration with Permits, MOC, and Incident Investigation
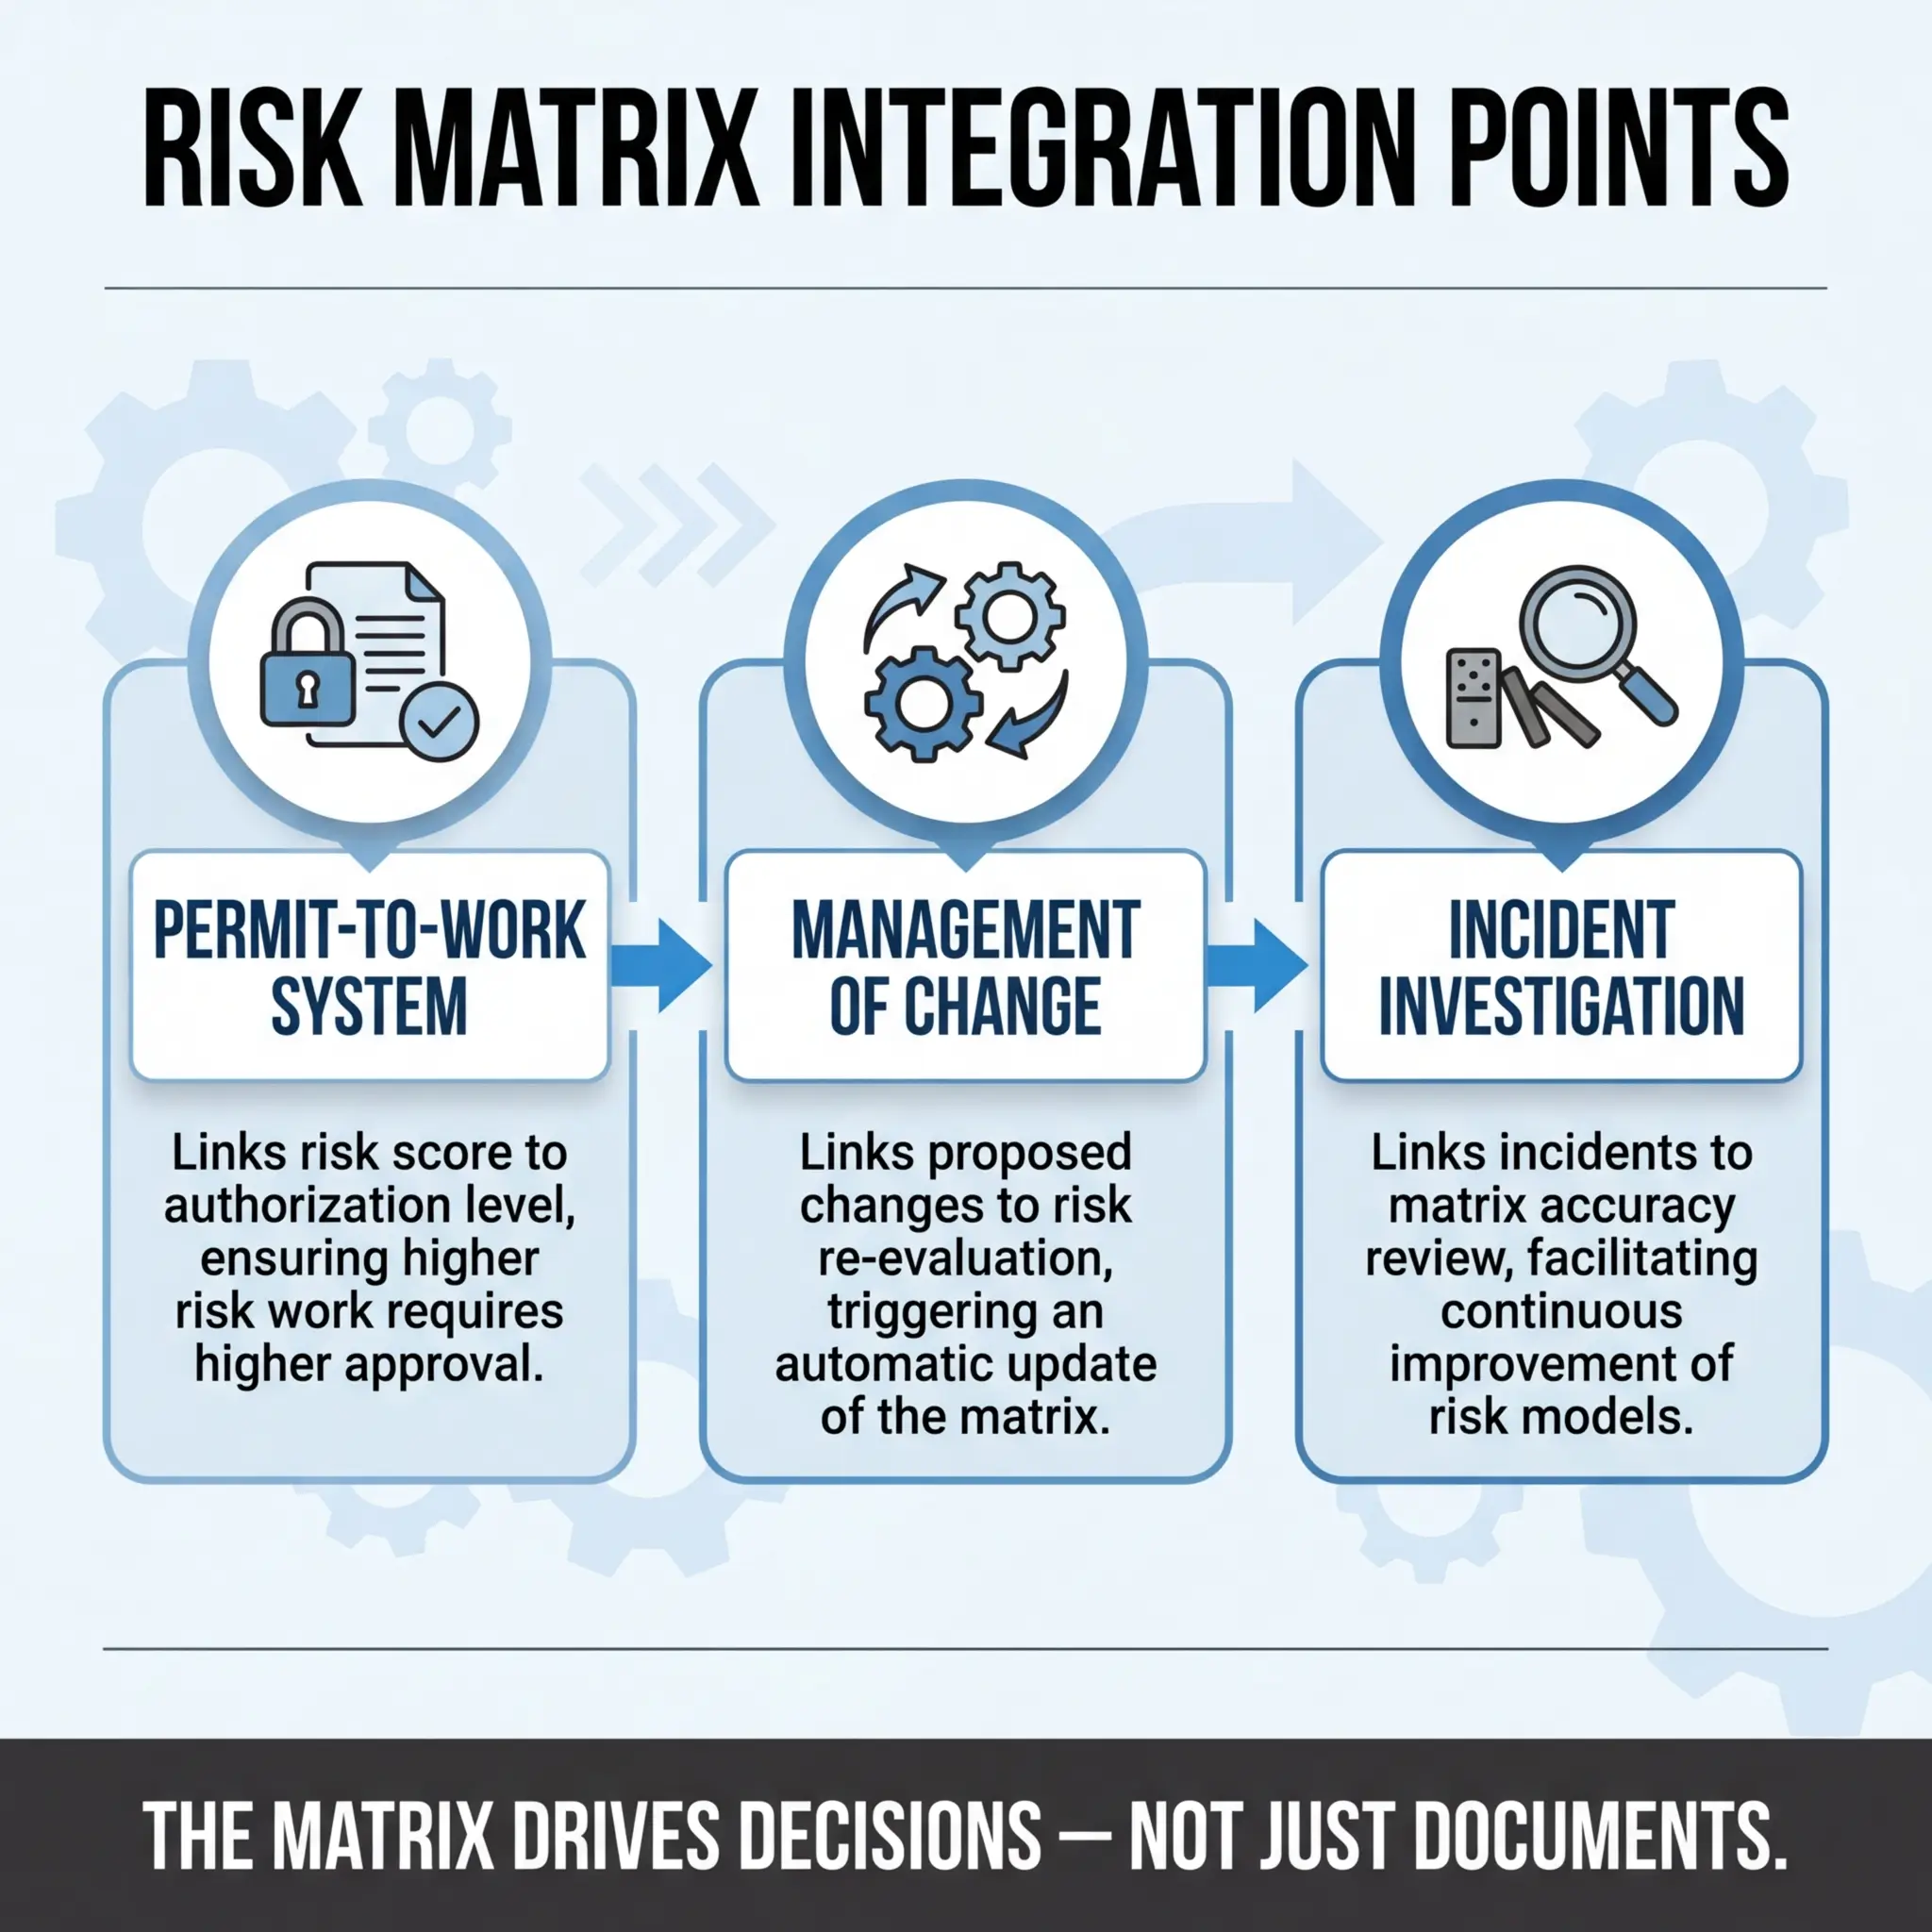
A risk matrix that lives only inside a standalone risk assessment document has limited operational impact. The real power emerges when it integrates into the daily decision-making systems that control work on site — permits to work, management of change processes, and incident investigation frameworks.
Permit-to-Work Integration
Every permit-to-work system I’ve helped design uses the risk matrix as the gateway control for permit authorization levels. The residual risk score from the matrix directly determines who can authorize the permit and what additional controls are mandatory.
The integration typically follows this authorization structure:
- Low risk (1–4): General work permit — authorized by frontline supervisor. Standard controls and PPE as per procedure.
- Medium risk (5–9): Specific work permit — authorized by area supervisor or safety officer. Task-specific method statement required. Pre-task briefing documented.
- High risk (10–16): Controlled work permit — authorized by site HSE manager or operations manager. Detailed method statement, additional safety measures, continuous monitoring, and rescue provisions as applicable.
- Critical risk (17–25): Exceptional permit — authorized by project director or site general manager only. Senior management review of risk assessment, enhanced controls, dedicated safety watch, emergency response team on standby. Consideration of whether the work should proceed at all.
Management of Change (MOC)
Risk matrices play a direct role in evaluating whether a proposed change — to equipment, procedures, personnel, chemicals, or scope — introduces new hazards or alters existing risk profiles. During an MOC review on a chemical processing facility, a seemingly minor change (substituting a cleaning solvent with a “less toxic” alternative) was scored through the risk matrix and revealed a higher flammability risk that the original product didn’t present. Without the matrix forcing that evaluation, the substitution would have proceeded and introduced a new fire hazard into an area classified as a non-hazardous zone.
Incident Investigation
After any incident or significant near-miss, the risk matrix for the relevant activity must be revisited. The investigation should answer specific questions about the matrix’s role:
- Was the hazard identified in the original risk assessment? If not, the HIRA process failed — not just the controls.
- Was the risk score accurate? If the incident occurred and the hazard was rated “unlikely,” the likelihood definition or scoring was wrong.
- Were the controls documented in the matrix actually implemented on site? A common finding — controls exist on paper but not in practice.
- Does the residual risk score need to be recalculated? Almost always yes, at least until corrective actions are verified.
Limitations of Risk Matrices: What the Tool Cannot Do
No experienced safety professional should treat a risk matrix as infallible. It is a semi-quantitative tool built on subjective judgment, and its limitations are well-documented in risk management literature. Acknowledging these limitations doesn’t weaken the tool — it strengthens how you use it by setting appropriate expectations.
The following limitations are inherent to the risk matrix methodology and must be understood by anyone relying on it for safety-critical decisions:
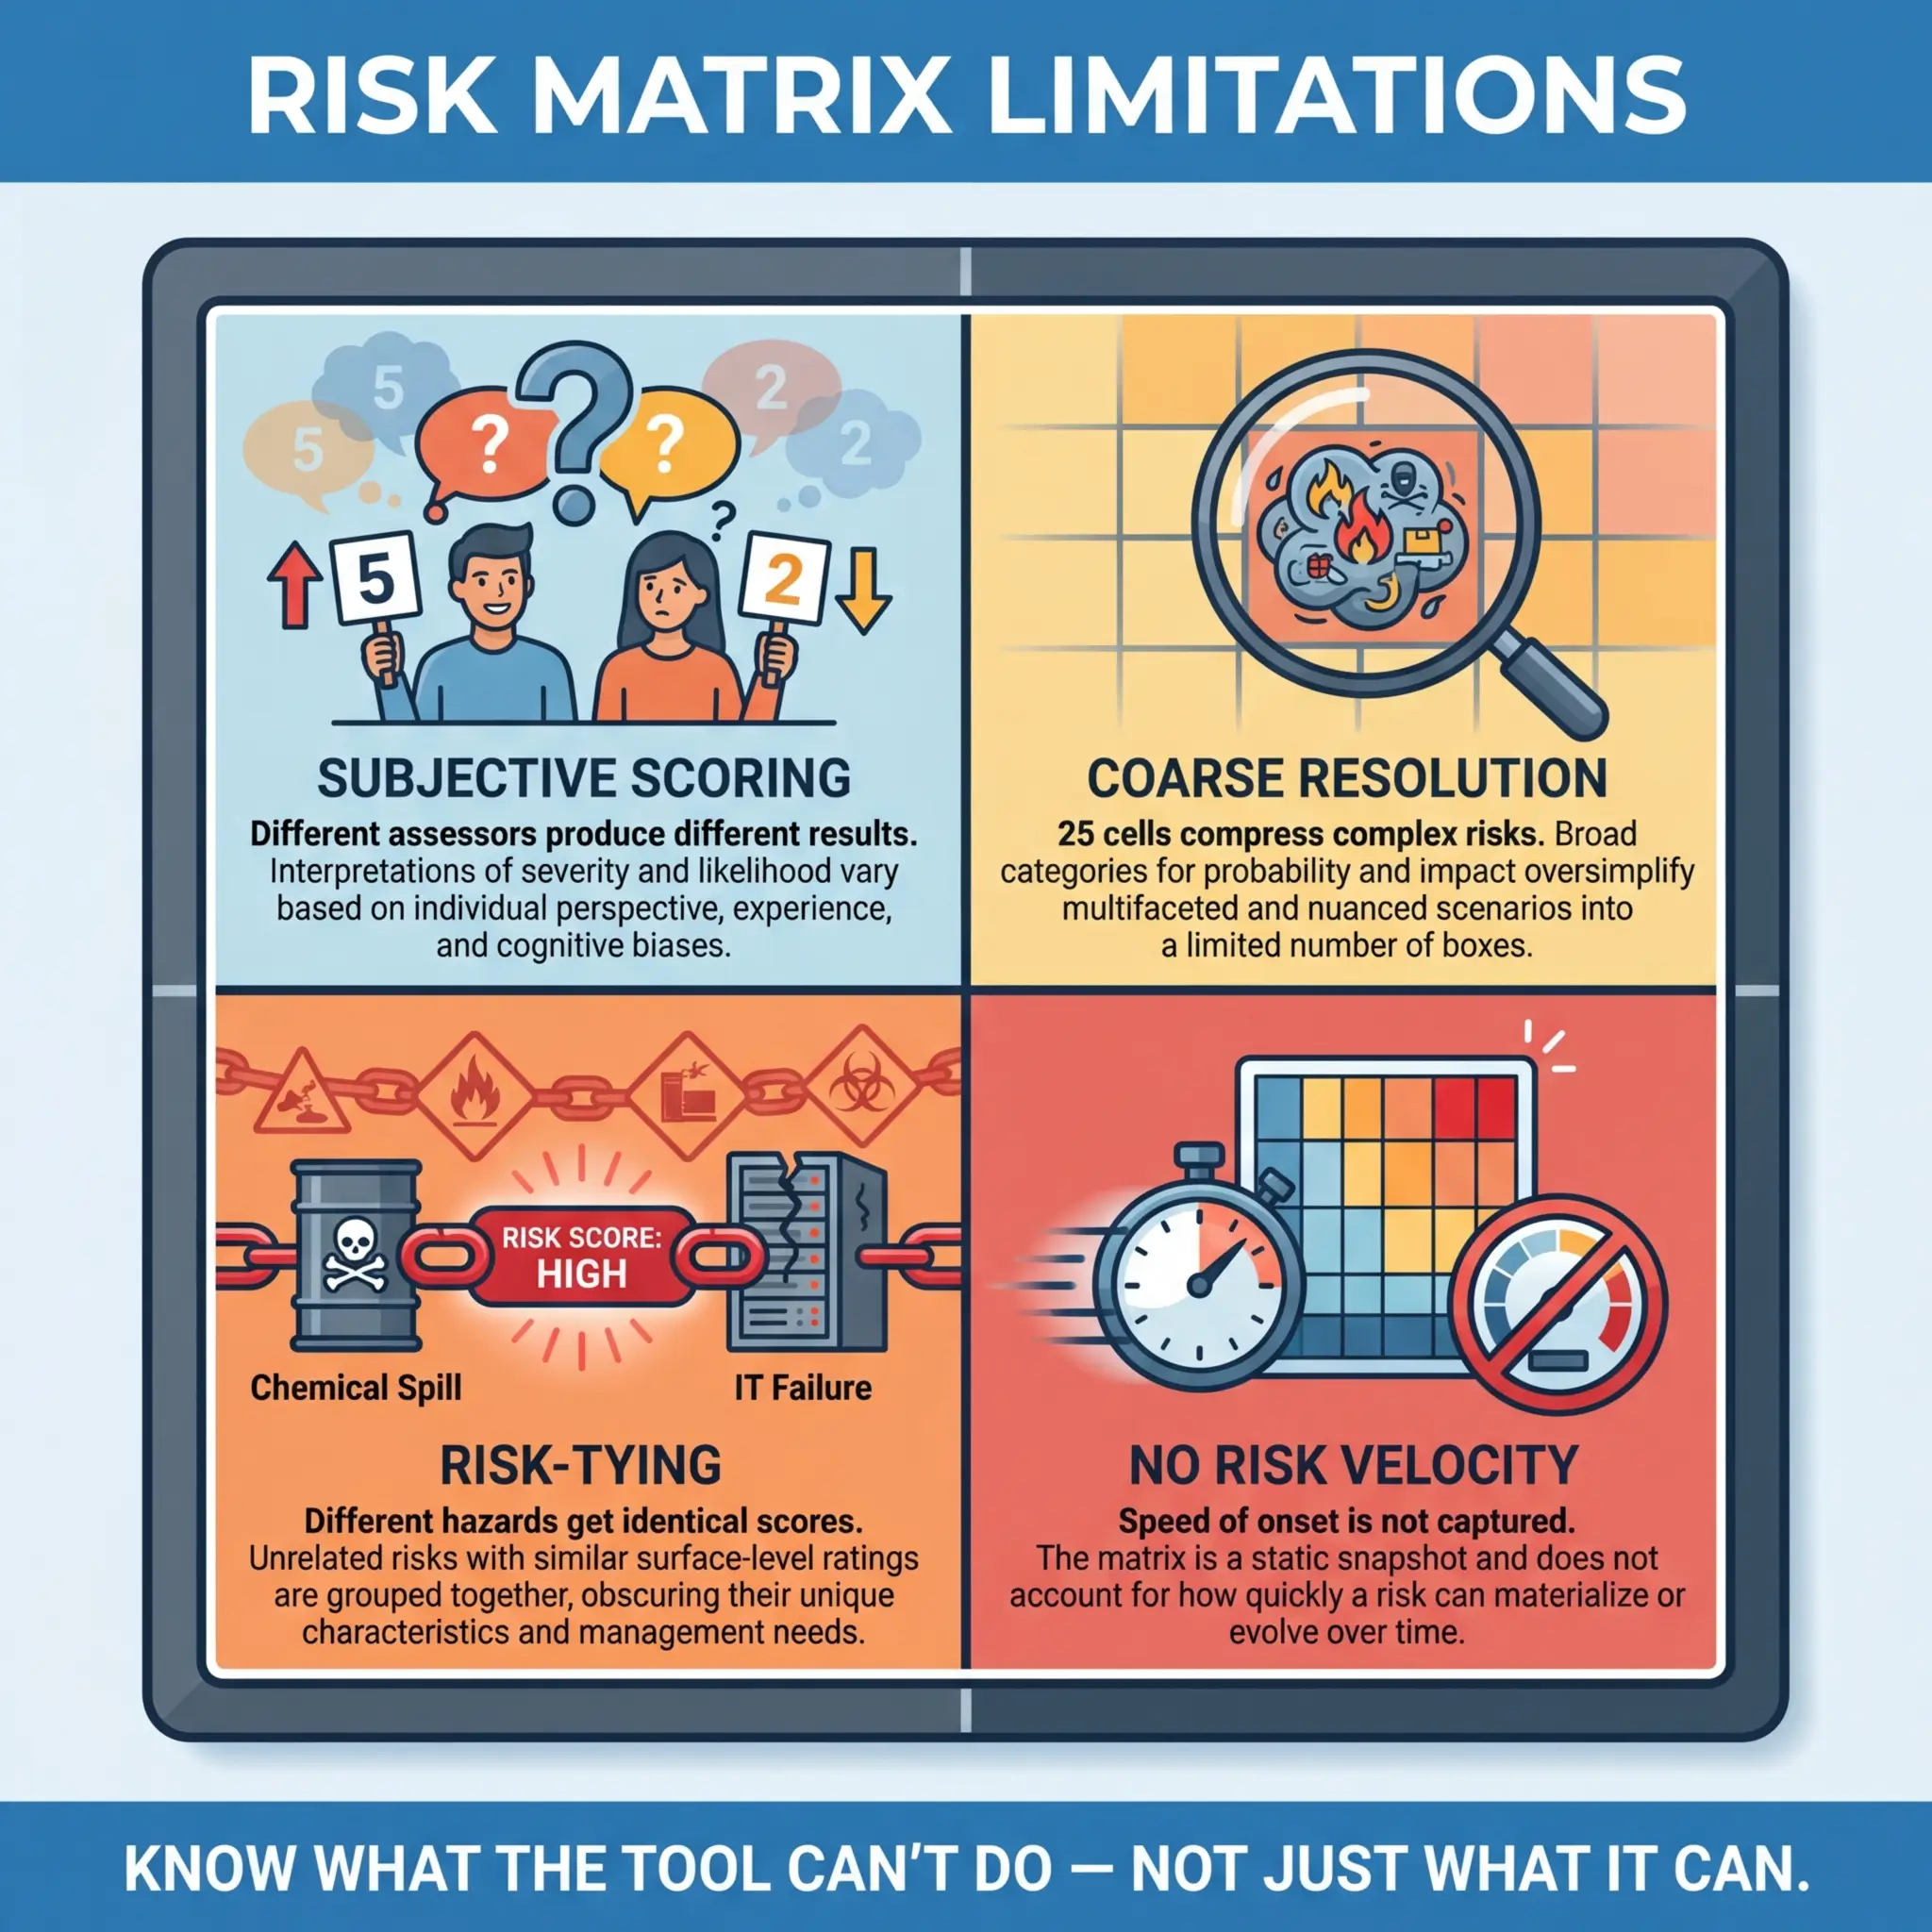
- Subjectivity in scoring. Two qualified assessors can legitimately arrive at different scores for the same hazard. The matrix structures judgment — it does not eliminate it. Calibration reduces but never fully removes this variability.
- Coarse resolution. A 5×5 matrix has only 25 possible scores. Complex, multi-variable risks are compressed into a single number. A hazard scored 12 and another scored 12 may have fundamentally different risk profiles that the matrix cannot distinguish.
- Risk-tying. Multiple hazards can land on the same score despite having very different characteristics and requiring very different controls. A chemical exposure risk scored 15 and a fall from height risk scored 15 are not equivalent in any practical sense — yet the matrix treats them identically.
- Range compression. The multiplication of two ordinal scales (likelihood × severity) creates a non-linear distribution where certain scores are mathematically impossible (e.g., a score of 7 can only be achieved by 1×7, which doesn’t exist on a 5-point scale). This creates artificial clustering and dead zones in the scoring range.
- Does not account for risk velocity. The matrix captures magnitude but not speed of onset. A slow-developing occupational disease and an instantaneous explosion can produce the same risk score, yet they demand entirely different response strategies and control implementation timelines.
- Binary thinking trap. Categorizing risks into “acceptable” and “unacceptable” zones can discourage continuous improvement. Once a risk is in the green zone, organizations often stop looking for further risk reduction — even when further reduction is reasonably practicable.
ISO 31000:2018 (Risk Management — Guidelines) recognizes that “the tools and techniques for risk assessment have inherent limitations” and emphasizes that the selection of assessment methods “should be consistent with the risk criteria, justified, and appropriate to the context.” No single tool — including the risk matrix — is sufficient for all risk management needs.
For high-consequence, low-probability events — process safety scenarios, major accident hazards, environmental catastrophes — a risk matrix alone is insufficient. These scenarios require bow-tie analysis, quantitative risk assessment (QRA), layer of protection analysis (LOPA), or HAZOP studies. The risk matrix is a screening tool. For complex risks, it is the starting point, not the destination.
Making Risk Matrices Work in the Real World
After years of building, auditing, and rebuilding risk assessment frameworks across industries, the factors that separate functional risk matrices from decorative ones are consistent. They have nothing to do with the matrix itself — they have everything to do with the organizational culture, training investment, and management commitment surrounding it.
The following practices consistently produce risk matrices that drive real safety outcomes on site:
- Train every user, not just safety staff. Supervisors, engineers, and crew leaders who complete risk assessments must understand the scoring criteria as well as the HSE team does. A one-hour workshop with practical scenarios is worth more than a 40-page procedure manual. Retrain annually and after any significant incident.
- Define your scales with operational language, not academic language. “Probable” and “improbable” are dictionary words, not operational criteria. Use frequency benchmarks, incident history references, and industry-specific language that your workforce understands without interpretation.
- Mandate field validation for every risk assessment. No risk matrix should be finalized without a physical walk-down of the work area and input from the crew performing the work. Office-based risk assessments are educated guesses at best.
- Build review triggers into the system. Risk assessments should not be reviewed on a calendar schedule alone. Triggers should include: any related incident or near-miss, scope or method change, new concurrent activities, significant weather events, workforce composition changes, and management of change approval.
- Hold the line on high-risk scores. If a risk assessment produces a critical score, that score must trigger a real operational response — not a footnote. Organizations that routinely accept critical risk scores with minor control adjustments are normalizing danger. Management must demonstrate that red-zone scores change plans, timelines, and budgets.
- Audit risk assessment quality, not just completion. Most HSE audits check whether risk assessments exist. Effective audits check whether the scores are credible, the controls are implemented, and the residual risk ratings are defensible. I spend more audit time reviewing whether a matrix was used correctly than whether it was completed.
Conclusion
A risk matrix is not a form to be filled in. It is a decision-making framework that, when calibrated, trained, and embedded into daily operations, gives safety professionals and supervisors a structured method to prioritize hazards, allocate resources, and protect workers from harm. Every risk assessment I’ve reviewed that genuinely prevented an incident shared the same characteristics — it was completed by people who understood the scoring criteria, validated by a walk-down of the actual work area, and treated as a living document that evolved with the operation.
The failures I’ve investigated share an equally consistent pattern. The matrix existed, but nobody used it as intended. Scores were clustered in the middle. Controls were generic. Residual risk ratings were reverse-engineered to avoid triggering management escalation. The tool was present, but the thinking behind it was absent. That gap — between having a risk matrix and actually using one — is where incidents live.
Risk management is not about eliminating every hazard from every job site. That is neither possible nor honest. It is about making informed, defensible decisions with the best information available, and accepting residual risk only when every reasonably practicable control has been applied. A properly used risk matrix is one of the most reliable tools we have for making those decisions visible, consistent, and accountable. The matrix doesn’t protect workers — the decisions it drives do.