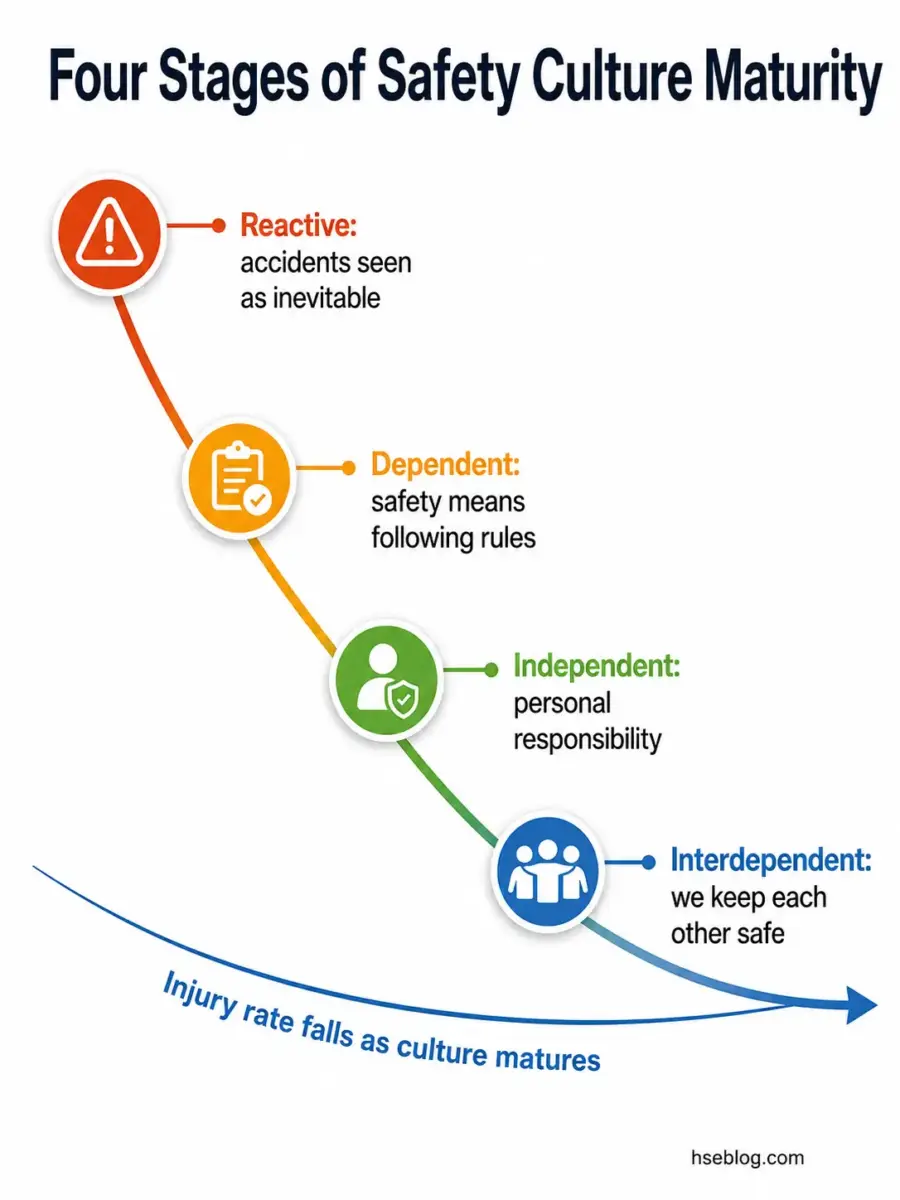
The Bradley Curve is a safety culture model describing four maturity stages — Reactive, Dependent, Independent, and Interdependent. It proposes that as an organization moves from reacting to incidents toward shared, collective ownership of safety, injury rates decline. Developed within DuPont in the 1990s, it is a descriptive diagnostic tool, not a regulatory standard or validated theory.
There is a widely repeated claim attached to the Bradley Curve: that an organization climbing from one stage to the next is the reason its injury rate drops. That causal reading is not supported by independent evidence — the figures most often cited trace back to DuPont promotional material, not peer-reviewed data, a gap academic reviewers have flagged directly.
That distinction matters more than it sounds. Safety-culture work still operates against a serious backdrop — US workplace fatalities reached 5,070 in 2024, a rate of 3.3 per 100,000 full-time-equivalent workers (US Bureau of Labor Statistics, 2026). This article explains the four stages accurately, traces the model's contested origins and its debt to Stephen Covey, compares it against more rigorous models, and shows where the Bradley Curve genuinely helps a practitioner and where it quietly misleads one.
What Is the Bradley Curve?
The Bradley Curve is a diagnostic and communication tool that plots safety-culture maturity on one axis and incident rate on the other, with the line trending down and to the right. It is descriptive, not prescriptive — it tells you roughly where a culture sits, not what to do next.
Its core premise is straightforward: most workplace incidents involve human behavior, and culture shapes behavior. The model packages that idea into four stages and a single memorable shape.
What the model actually claims:
- Maturity and injury rate move together. As culture advances through the stages, recorded injuries are expected to fall.
- Behavior is the lever. The framing assumes shifting how people think about safety changes what they do.
- It is a shared language, not a method. The curve gives teams a common vocabulary for "where we are" — nothing more.
- It carries no compliance weight. It is not a standard, not a certification route, and not a legal obligation.
A pattern worth naming up front: teams can almost always tell you which stage they think they occupy, but they struggle to articulate the specific action that would move them up. That is the model working exactly as designed — it diagnoses, it does not prescribe.
Who Created the Bradley Curve? Origins and the Covey Connection
The honest answer to "who created it" is that the attribution is poorly documented, and most articles that confidently name a date are repeating each other rather than a primary source. There is no original scientific publication that defines the model.
What can and cannot be stated with confidence:
- It emerged inside DuPont and was popularized in the mid-1990s as part of the company's safety consulting work.
- The named "Bradley" is contested — sources disagree even on the first name, and no primary publication settles it. Asserting a definitive name would be inventing certainty the record does not support.
- The earliest descriptions are promotional, not peer-reviewed, which is why the model entered the industry as marketing before it was ever tested as theory.
The Covey Connection
The model's intellectual backbone is borrowed. Three of its four stages — dependent, independent, interdependent — come straight from Stephen Covey's 7 Habits maturity continuum, with "reactive" added in front.
That borrowing introduces an unstated assumption. Covey described those stages as a progression for individuals developing personal habits — and crucially, as the outcome of forming habits, not a target to chase directly. The Bradley Curve repurposes them as a goal for whole organizations to pursue, which quietly inverts Covey's own logic. A model built to describe personal growth is being asked to govern collective culture, and that mismatch sits underneath every later claim the curve makes.
The Four Stages of the Bradley Curve Explained
The four stages run Reactive → Dependent → Independent → Interdependent, and each is defined by a different answer to one question: who owns safety here? The table maps the prevailing mindset, the driver, and the typical injury trend at each stage.
| Stage | Prevailing mindset | Who drives safety | Typical injury trend |
|---|---|---|---|
| Reactive | "Accidents happen — part of the job" | No one; instinct and luck | High and volatile |
| Dependent | "Safety means following the rules" | Supervision, discipline, management | Falls sharply, then plateaus |
| Independent | "I'm responsible for my own safety" | The individual worker | Lower; gains from personal commitment |
| Interdependent | "We keep each other safe" | The whole team; peer intervention | Lowest; hardest to reach and sustain |
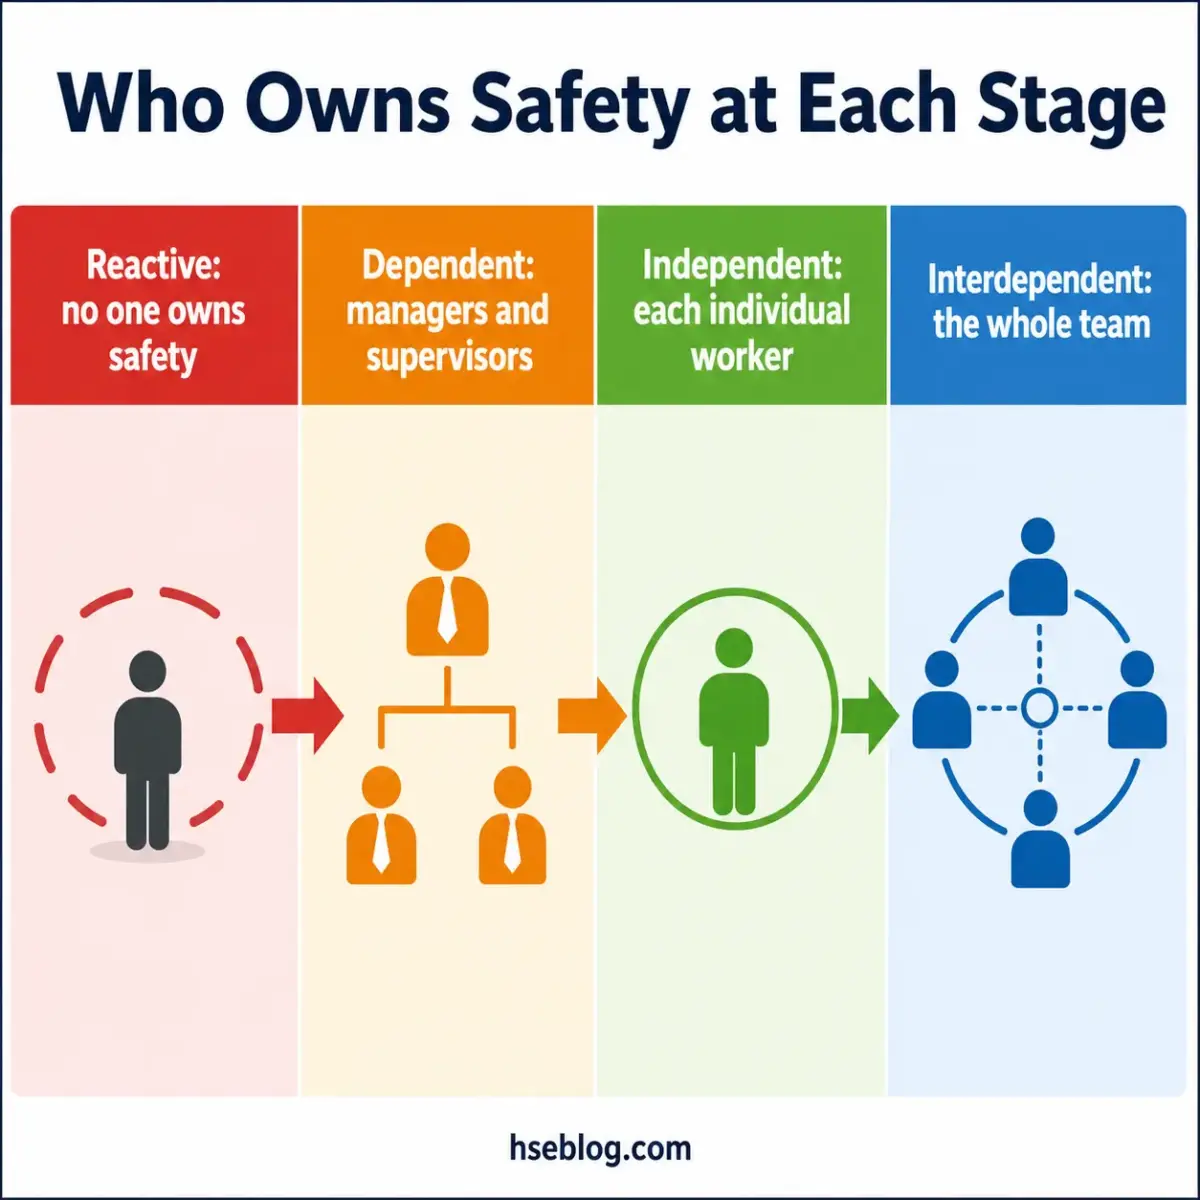
Stage 1 — Reactive
Safety here is driven by instinct, and accidents are treated as an unavoidable cost of the work. Action follows incidents rather than preventing them, and no one holds genuine ownership. Injury rates are high and swing unpredictably.
Stage 2 — Dependent
Safety becomes a matter of obeying rules, enforced through supervision, discipline, and visible management commitment. This stage produces real, rapid gains — and then a well-described plateau. Enforcement alone reduces injuries to a point, after which it stops delivering, because compliance under watch does not transfer to behavior when no one is watching.
Stage 3 — Independent
The shift here is internal: workers take personal responsibility, and safety becomes a value rather than an imposed rule. Knowledge, competence, and self-management drive behavior instead of fear of discipline.
Stage 4 — Interdependent
This is the aspirational endpoint, where ownership turns collective and people intervene to protect colleagues. Peer-to-peer correction becomes normal, and "injury-zero" is treated as attainable. It is also the hardest stage to reach and, more importantly, the hardest to hold.
A frequent failure mode deserves emphasis: practitioners treat the curve as a one-way ratchet. It is not. Cultures regress under production pressure, restructuring, or leadership turnover — position on the curve is earned continuously, not banked permanently.
How to Move Through the Stages
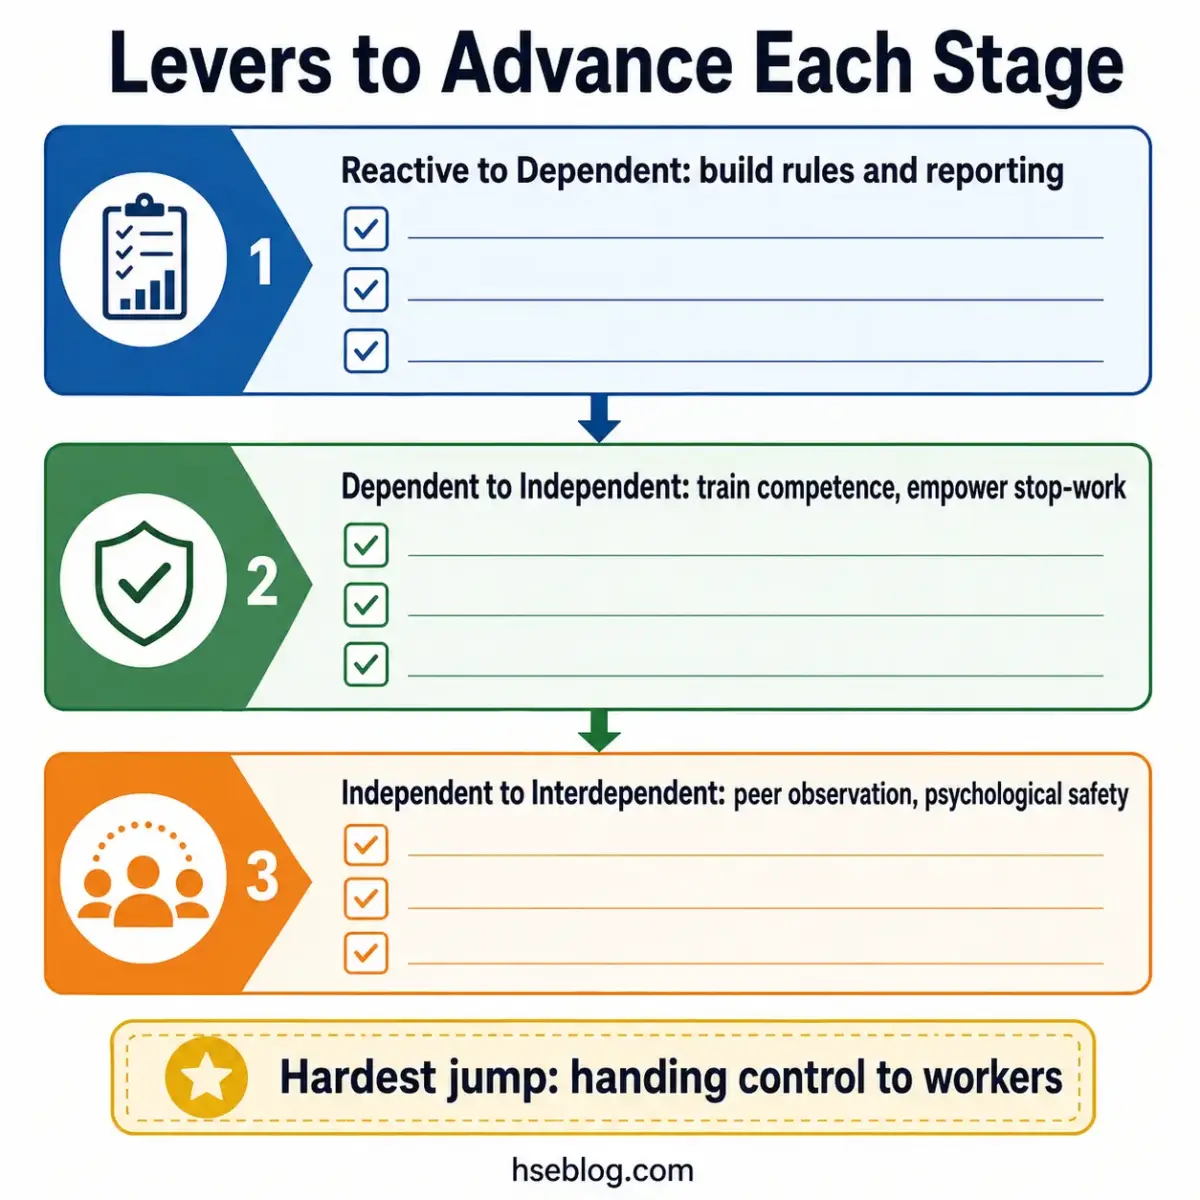
In practice, the curve does not tell you how to advance — and this is its most under-acknowledged limitation. Moving up requires bolting on other tools the model itself never supplies: behavior-based safety, leadership engagement, competency training, and honest climate assessment. Below are the realistic levers for each gap.
- Reactive → Dependent. Build the scaffolding. Establish rules and systems, set up near-miss and hazard reporting, and make management commitment visible rather than assumed.
- Dependent → Independent. Shift the source of motivation from enforcement to ownership. Invest in competency-based training, give workers genuine authority to stop unsafe work, and reward judgment, not just rule-following.
- Independent → Interdependent. Engineer the conditions for mutual accountability. Introduce peer observation, build psychological safety so people speak up without fear, and make looking out for others an expected norm.
The hardest transition is Dependent → Independent — and it is counterintuitive. It asks management to loosen control just as compliance has started cutting injuries. Letting go of the lever that appears to be working feels wrong, which is exactly why so many programs stall at the plateau.
Bradley Curve vs Other Safety Culture Models
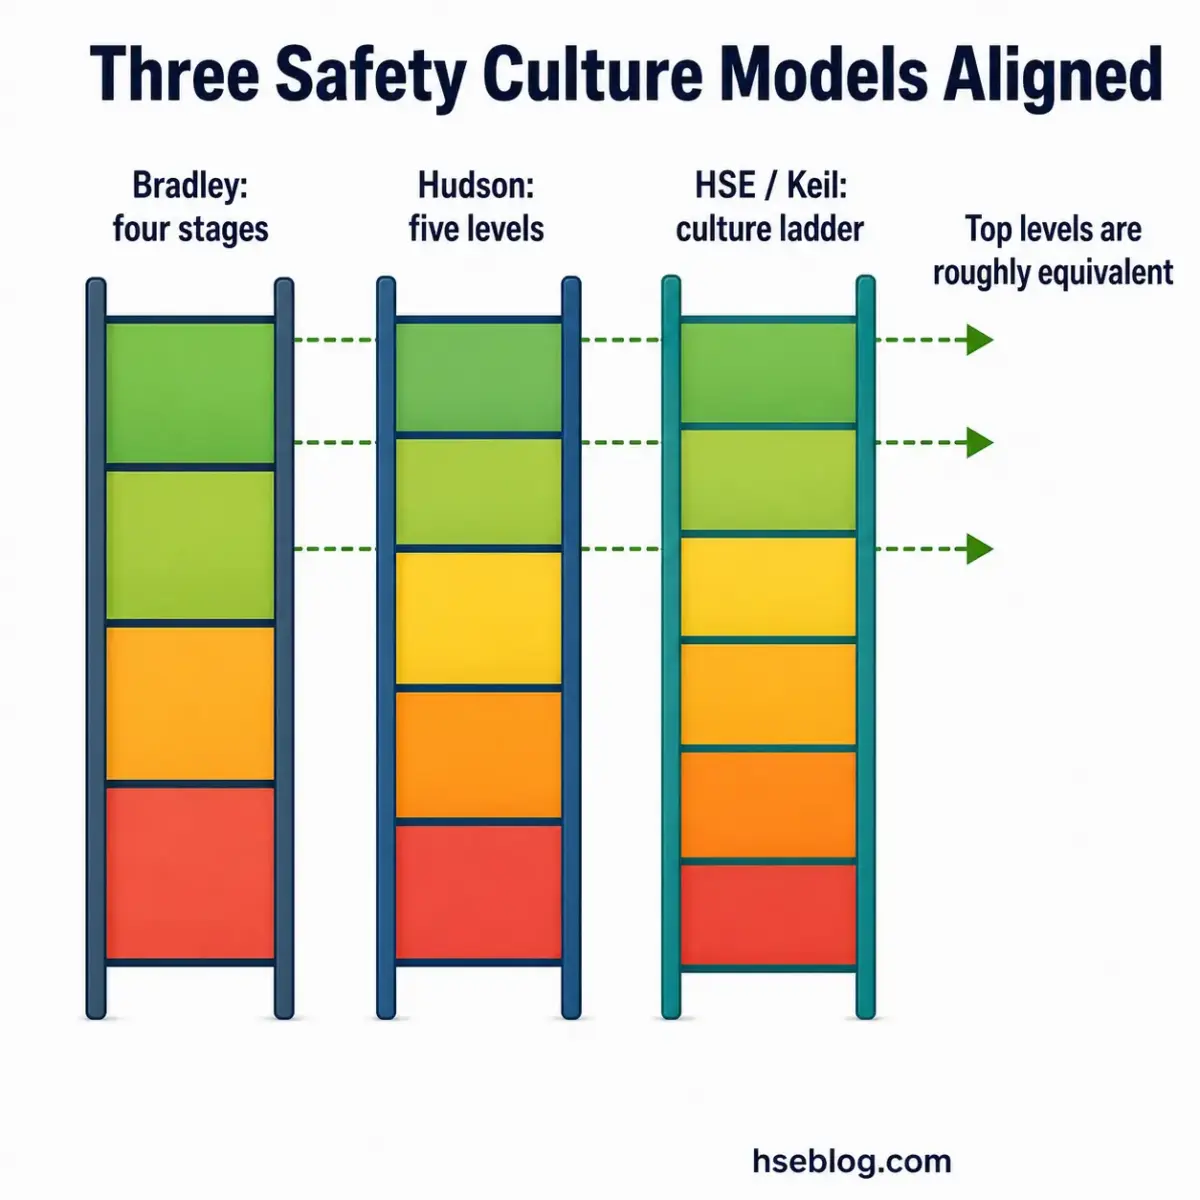
The Bradley Curve is one of several overlapping maturity models, and it is neither the first nor the most rigorous — a fact most vendor explainers omit. Its closest peers are Hudson's five-level ladder, rooted in Westrum's organizational typology and the validated basis for Shell's Hearts and Minds programme, and the HSE/Keil Centre culture ladder. The three describe similar trajectories with very different evidentiary weight.
| Bradley Curve (4 stages) | Hudson ladder (5 levels) | HSE / Keil Centre ladder |
|---|---|---|
| Reactive | Pathological / Reactive | Emerging |
| Dependent | Calculative | Managing |
| Independent | Proactive | Involving |
| Interdependent | Generative | Continually improving |
Mappings are approximate — the models were built independently and do not align cleanly.
Reading across the row tells the story: the endpoints are near-equivalent. "Interdependent" (Bradley) sits roughly where "Generative" (Hudson) and "Continually improving" (Keil) sit.
The trade-off between them is real:
- Bradley's strength is communicability. Four stages and a single curve are easy to teach and easy to rally a workforce around.
- Bradley's weakness is diagnostic granularity. It tells you the rough zone but not the texture, and it has the thinnest academic grounding of the three.
- Hudson's strength is rigor. It draws on Westrum's information-flow typology, which has been studied and applied more seriously.
Limitations and Criticisms of the Bradley Curve
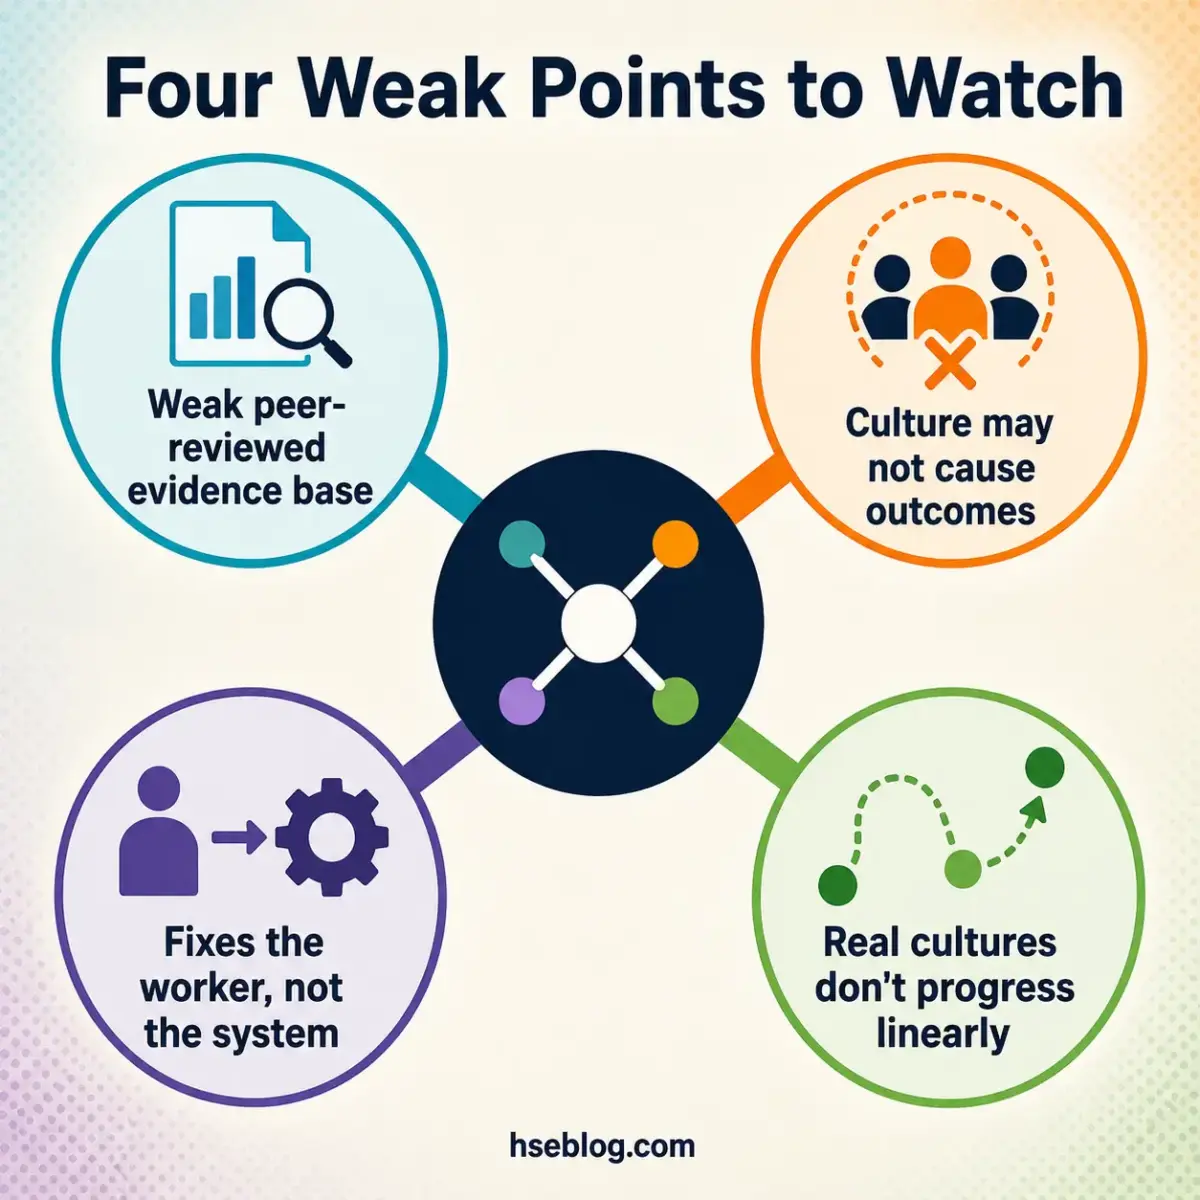
The most important thing to understand about the Bradley Curve is the weakness almost no top-ranking page mentions: its evidence base is thin, and several of its core assumptions are openly contested in the literature. None of this makes it useless — but using it well means knowing where it breaks.
Evidence and causation problems:
- Weak validation. There is little to no peer-reviewed evidence behind the model, and the injury-reduction figures so often quoted trace to DuPont promotional material rather than primary research — a point academic reviewers have made directly.
- Reverse-causality risk. The model assumes culture drives outcomes. But systemic factors — hazardous design, production pressure, degrading controls — can drive both the culture and the injuries, meaning maturity may be a symptom of good conditions rather than their cause.
Structural and conceptual problems:
- The "fix the worker" bias. By centering individual behavior, the model can pull attention away from system design — the area HSE's own human-factors guidance, HSG48 (UK), was written to foreground. That bias matters when the leading fatal events are systemic: transportation incidents alone accounted for 38.2% of US occupational fatalities in 2024 (US Bureau of Labor Statistics, 2026).
- The linear-progression myth. Real organizations do not advance in neat, uniform stages across every team and site at once.
- Descriptive, not diagnostic. It labels a state without measuring it or prescribing a remedy, which is why it cannot stand alone as an improvement program.
The practitioner's reading: the curve earns its keep as a shared-language diagnostic paired with a metric-based framework such as the elements of ISO 45001 — not as a standalone program. Treated as a conversation-starter it is genuinely useful; treated as proof that culture caused your numbers, it misleads. The growing systems-thinking and ICAM critiques, and the line of argument that safety-culture maturity is "a problem disguised as a solution," reflect a field steadily moving past behavior-only models — a shift visible across recent peer-reviewed analysis (2026).
How the Bradley Curve Fits With ISO 45001 and Modern Safety Management
Read against current standards, the Bradley Curve is best understood as a conceptual companion to a management system — not a replacement for one and certainly not a route to certification. The trajectory it sketches informally is, in many ways, the same one ISO 45001:2018 (Global) requires formally: leadership commitment, worker participation, hazard identification, and continual improvement.
The loose mapping is easy to see. The curve's move from supervision-driven compliance toward worker ownership tracks ISO 45001's emphasis on genuine worker participation, and its "interdependent" endpoint echoes the standard's continual-improvement cycle. Where the standard demands documented systems and auditable evidence, the curve offers only language — which is precisely why it works as an aid and fails as a substitute.
Where ISO 45003 Exposes a Blind Spot
The curve was built around physical-safety behavior, and that scope shows its age. ISO 45003:2021 (Global) extends occupational health into psychosocial risk — workload, harassment, fatigue, the psychological conditions a behavior-only model never accounts for.
- The curve never addresses psychosocial hazard. A workforce can look "interdependent" on the physical-safety curve while carrying serious psychosocial risk underneath.
- Psychological safety is now structural, not optional. ISO 45003 treats it as a managed risk, not a nice-to-have culture trait.
- Modern practice pairs the two. Use the curve to start the conversation about ownership; use the management-system standards to make that conversation accountable.
Frequently Asked Questions
Who really invented the Bradley Curve?
The honest answer is that no one can say for certain. The model emerged within DuPont and was popularized in the mid-1990s, attributed to an employee named Bradley — though sources disagree on the first name and no primary publication documents it. Its later stages are adapted from Stephen Covey's maturity continuum, so its lineage is clearer than its named author.
Is the Bradley Curve scientifically proven?
No. It is a descriptive model that lacks peer-reviewed validation, and the injury-reduction claims attached to it trace to industry and promotional material rather than primary research. More academically grounded models, such as Hudson's ladder built on Westrum's typology, rest on stronger evidence. Treat the Bradley Curve as a communication tool, not proven science.
What is the difference between the Independent and Interdependent stages?
Independent is about the self — each worker takes personal responsibility and keeps themselves safe. Interdependent is collective — people actively look out for one another and intervene when a colleague is at risk. The shift is from "I keep myself safe" to "we keep each other safe," and it is the model's hardest transition to achieve and sustain.
Can an organization move backward on the Bradley Curve?
Yes. Position on the curve is not permanent. Cultures regress under leadership turnover, restructuring, cost-cutting, or sustained production pressure, when shortcuts quietly become acceptable again. Treating maturity as a one-way ratchet is a common and costly mistake — gains have to be actively maintained, not banked.
How do you measure where you are on the Bradley Curve?
The curve itself supplies no measurement instrument, which is one of its limitations. Practitioners use safety climate or perception surveys, structured behavioral observation, and a balance of leading indicators (reporting rates, participation) against lagging ones (injury rates). The model gives you the vocabulary; the measurement has to come from tools bolted on alongside it.
Does a higher stage guarantee fewer injuries?
No. Maturity is associated with lower injury rates, but association is not proof of cause. Systemic factors — hazard design, production demands, control quality — can drive both culture and outcomes, raising a genuine reverse-causality concern. A mature-looking culture with degraded engineering controls can still produce serious harm.
Conclusion
The industry's recurring error with the Bradley Curve is mistaking a vocabulary for a verdict. It is widely taught as if climbing the stages is the proven cause of falling injury rates, when the evidence for that causal claim simply isn't there — and reading it that way invites complacency about the systemic factors that quietly drive both culture and outcomes.
The single highest-impact change a practitioner can make is to demote the model from "improvement program" to "shared diagnostic." Used to open an honest conversation about who owns safety, paired with the auditable structure of ISO 45001 and the psychosocial lens of ISO 45003, the Bradley Curve does real work. Used as standalone proof of progress, it flatters numbers that may have nothing to do with culture at all.
Against a backdrop where fatalities still run into the thousands each year, that distinction is not academic. The competent reading of the Bradley Curve is the modest one: a useful map of the terrain, never a substitute for walking it.