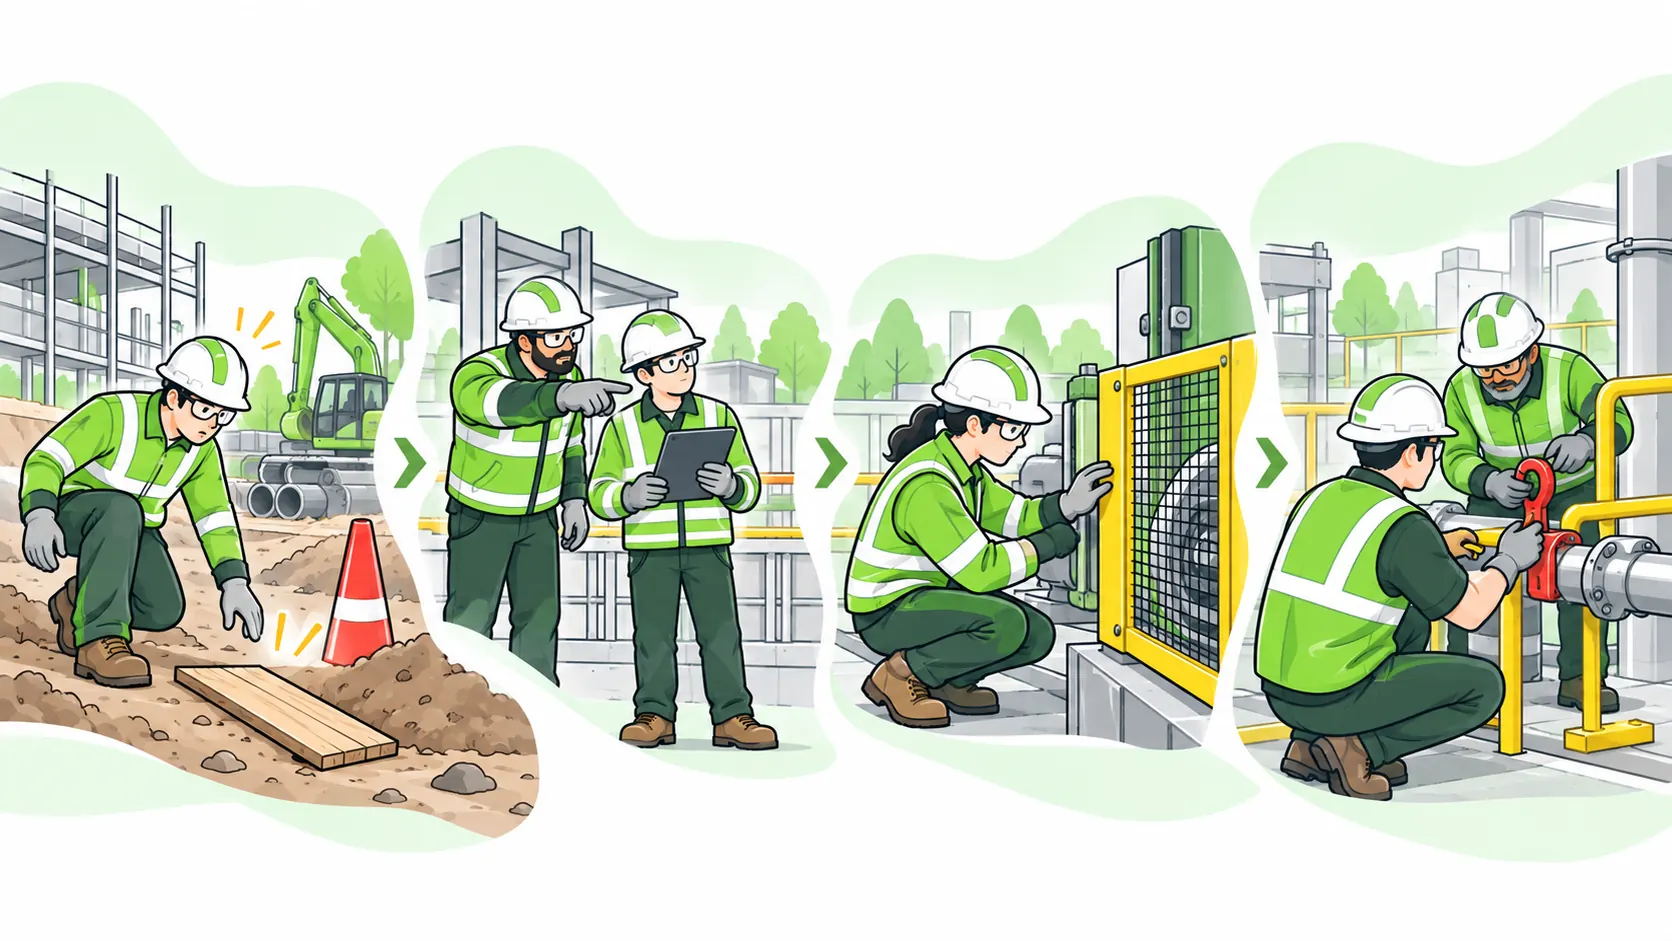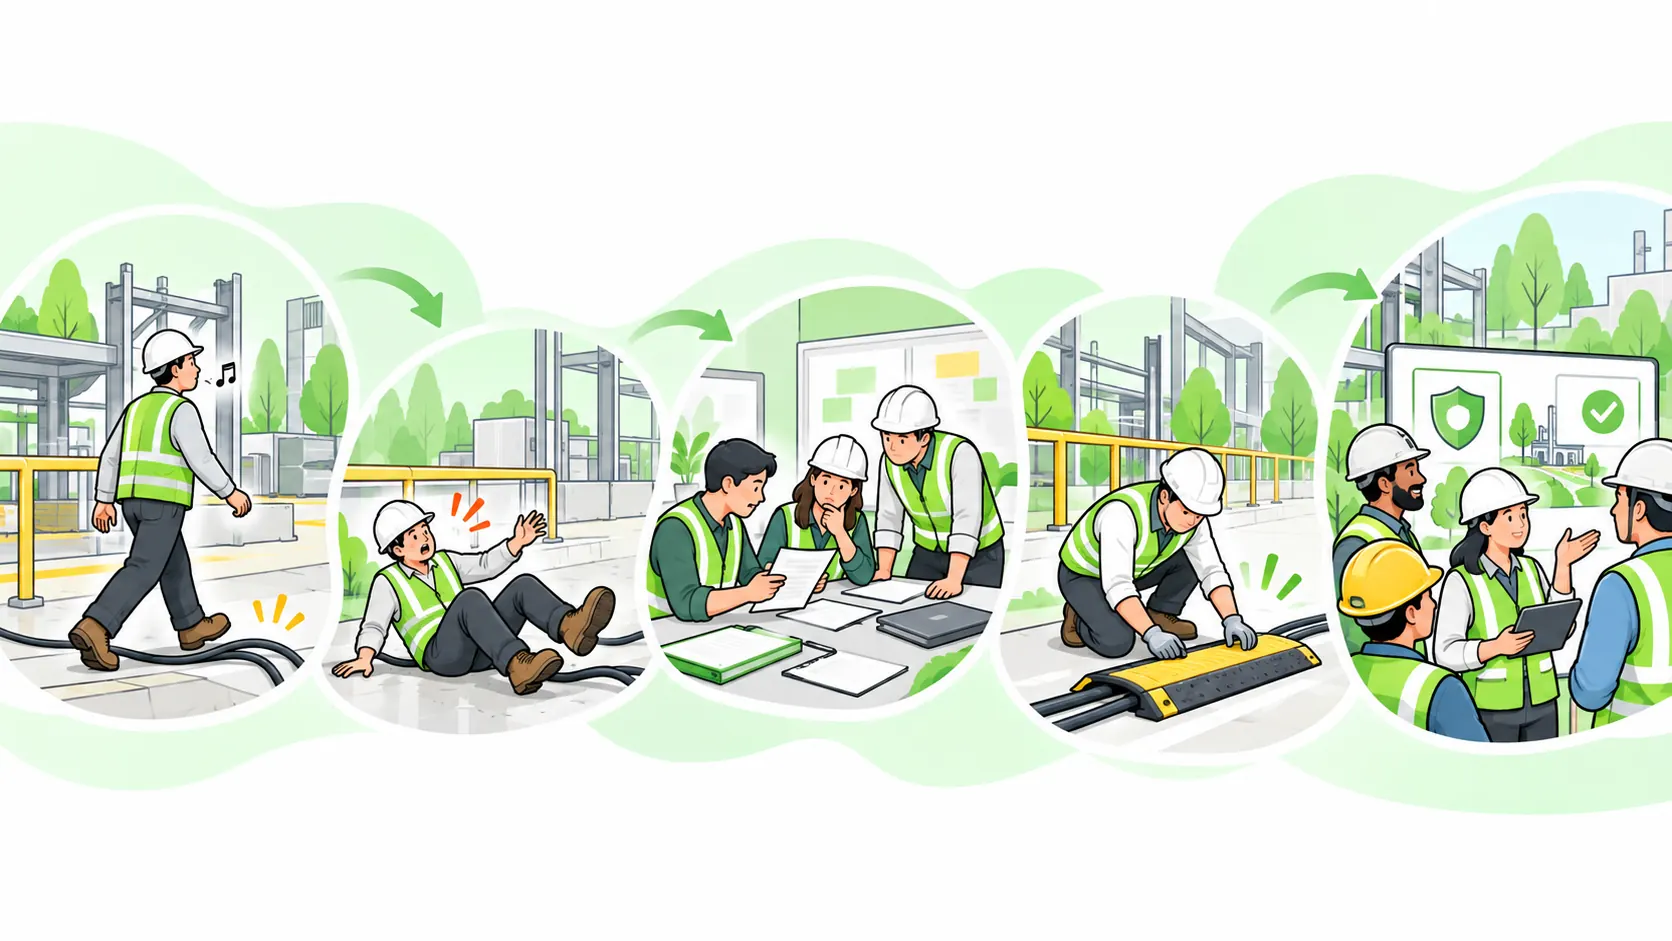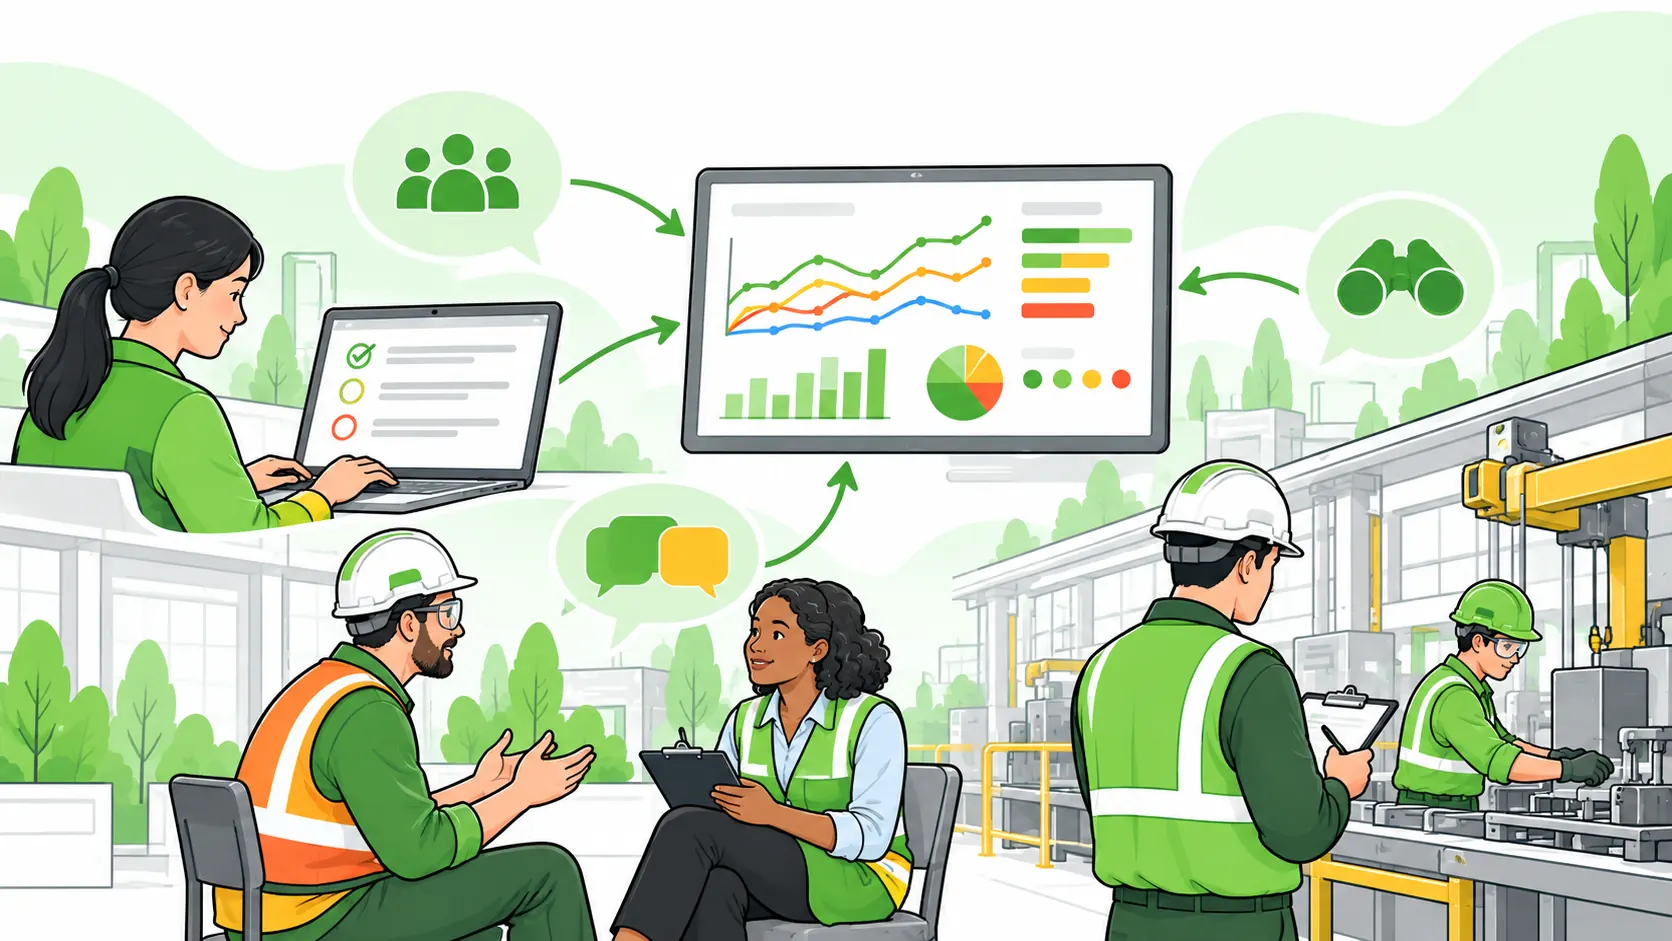
A safety perception survey is a structured, usually anonymous questionnaire measuring how workers perceive safety — management commitment, trust, communication, procedures, and reporting culture. It captures safety climate as a leading indicator, signalling risk before incidents occur, and provides evidence for worker-participation duties under standards such as ISO 45001 Clause 5.4.
A persistent and dangerous belief sits behind most failed surveys: that measuring perception is easy. Teams draft a list of yes/no questions, label it a "perception survey," and treat the output as fact — yet a questionnaire that hasn't been tested for validity tells you almost nothing reliable about your safety climate.
That gap matters because perceptions are not soft data. Group safety climate showed the strongest association with accidents and injuries among the factors examined in a major meta-analysis of behavioural safety research (Christian, Bradley, Wallace & Burke, Journal of Applied Psychology, 2009) — which means a well-built safety perception survey measures something that genuinely predicts harm. This guide covers the full method: how the instrument works, how to choose or build one without losing validity, how to run it so people answer honestly, and how to turn the results into action and re-measurement.
What Is a Safety Perception Survey (and How It Differs from a Safety Culture Audit)?
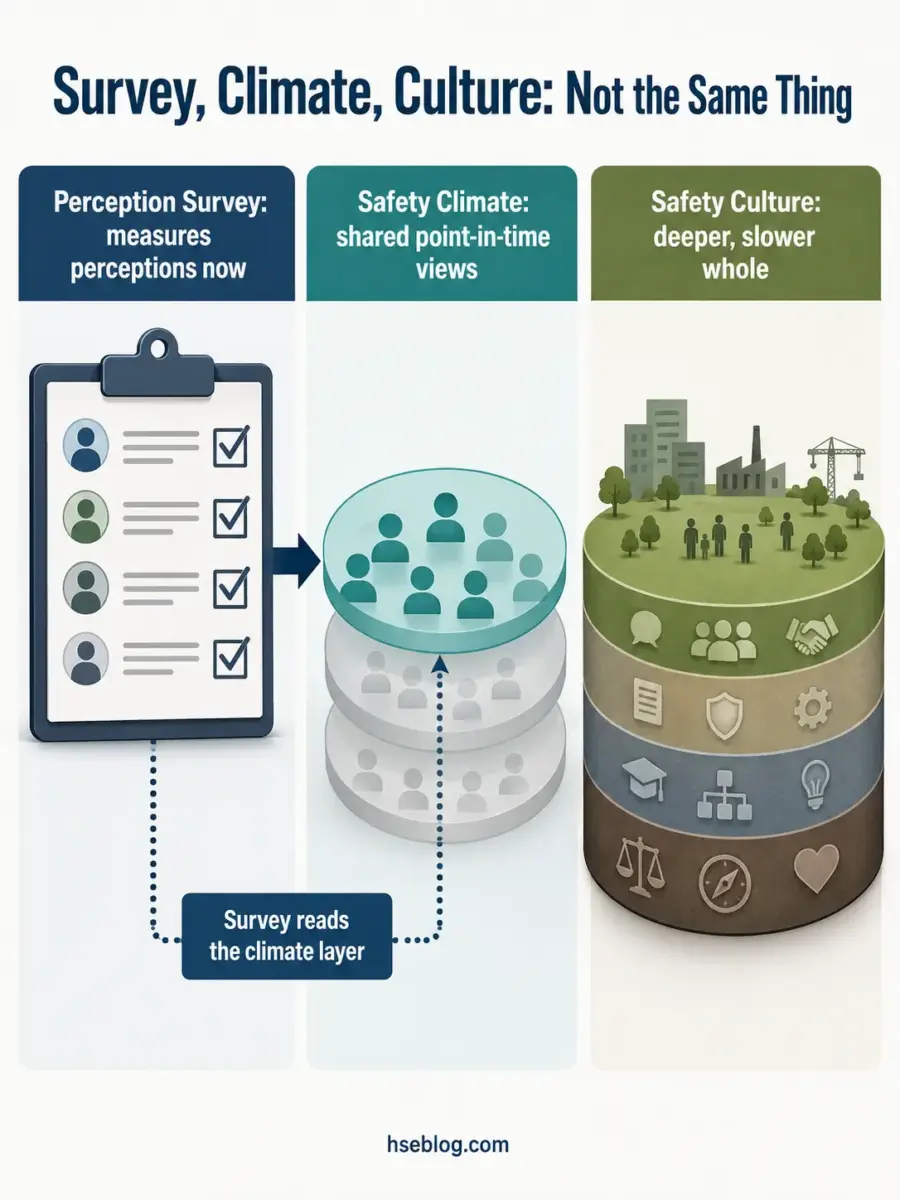
A safety perception survey is a structured questionnaire that measures what your workforce believes about safety — not what the records say happened. It reads the climate: the shared, current perception of how seriously management treats safety, whether reporting is safe, and whether procedures match reality.
People conflate three things that are not interchangeable. Getting the distinction right is the first step to designing something useful.
| Concept | What it is | Time horizon |
|---|---|---|
| Perception survey | The measurement instrument — a questionnaire scoring worker perceptions | Point-in-time snapshot |
| Safety climate | The shared perceptions the survey measures | Current, fast-changing |
| Safety culture | The deeper, embedded whole — values, habits, "how things are really done" | Slow-changing |
The survey measures climate as a proxy for culture. You cannot photograph culture directly, so you measure the perception layer that sits on top of it and track movement over time.
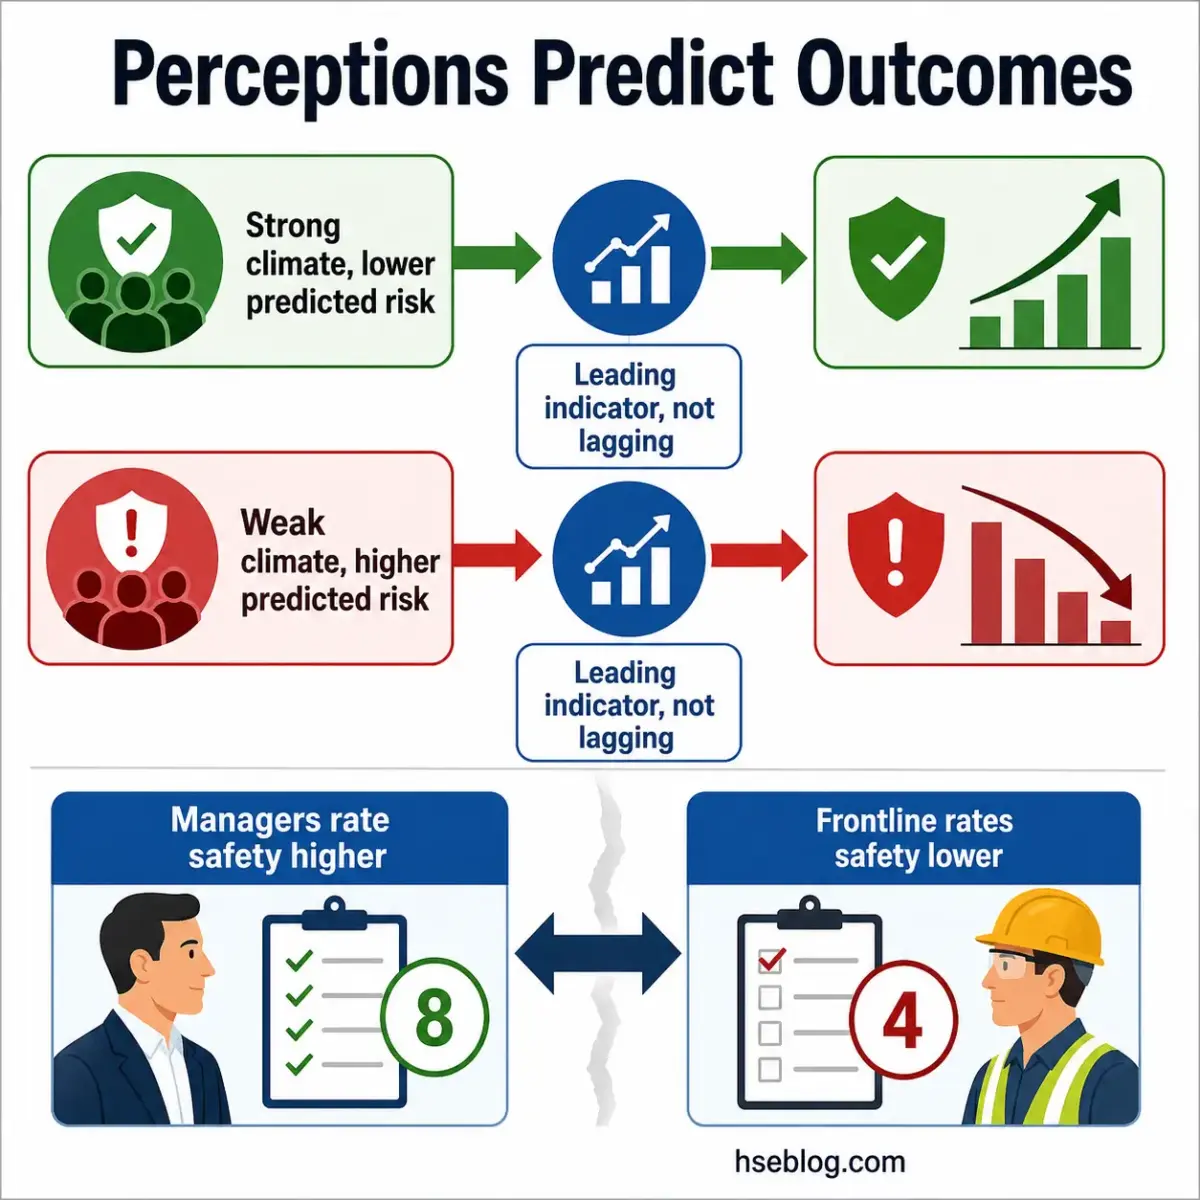
This is also why it qualifies as a leading indicator rather than a lagging one. Injury rates tell you what already went wrong; perception scores signal where confidence, trust, or procedural compliance is eroding before an incident converts that erosion into harm.
The first failure mode appears right here. A list of yes/no questions assembled in an afternoon is not equivalent to a validated instrument, even though both produce numbers — and treating any questionnaire as interchangeable with a tested one is how organisations end up confidently acting on noise.
Why Safety Perception Surveys Matter: The Leading-Indicator Case
The strongest argument for running one is empirical, not aspirational: workforce perceptions predict objective outcomes. In the meta-analysis behind most modern climate practice, group safety climate showed the strongest association with accidents and injuries among the antecedents examined (Christian et al., Journal of Applied Psychology, 2009) — the meta-analytic evidence linking safety climate to accidents and injuries that justifies treating perception as a forward-looking signal.
Regulators and standards bodies have followed that evidence. The practical effect for an HSE manager:
- OSHA recognises perception data as a leading indicator. Its guidance on leading indicators names safety-perception-survey participation rate as a worker-participation indicator and average scores on management-commitment questions as a leadership indicator (US, 2016 Recommended Practices and subsequent guidance).
- ANSI/ASSP Z16.1-2022 gives the metric consensus legitimacy. The standard frames leading, lagging, and impact metrics together, positioning perception/climate measures as recognised leading indicators (US voluntary consensus standard, 2022).
- ISO 45001 pulls toward worker participation. Clause 5.4 expects processes for consulting and involving non-managerial workers, and a perception survey is a recognised mechanism to evidence that (global, 2018).
The value managers underestimate is diagnostic, not just confirmatory. A common pattern: leadership is genuinely surprised by a gap they "didn't see," because managers consistently rate their own safety commitment higher than the frontline rates it — and the survey's real payoff is exposing that delta, not the absolute scores.
Choosing Your Instrument: Validated Tools vs Building Your Own
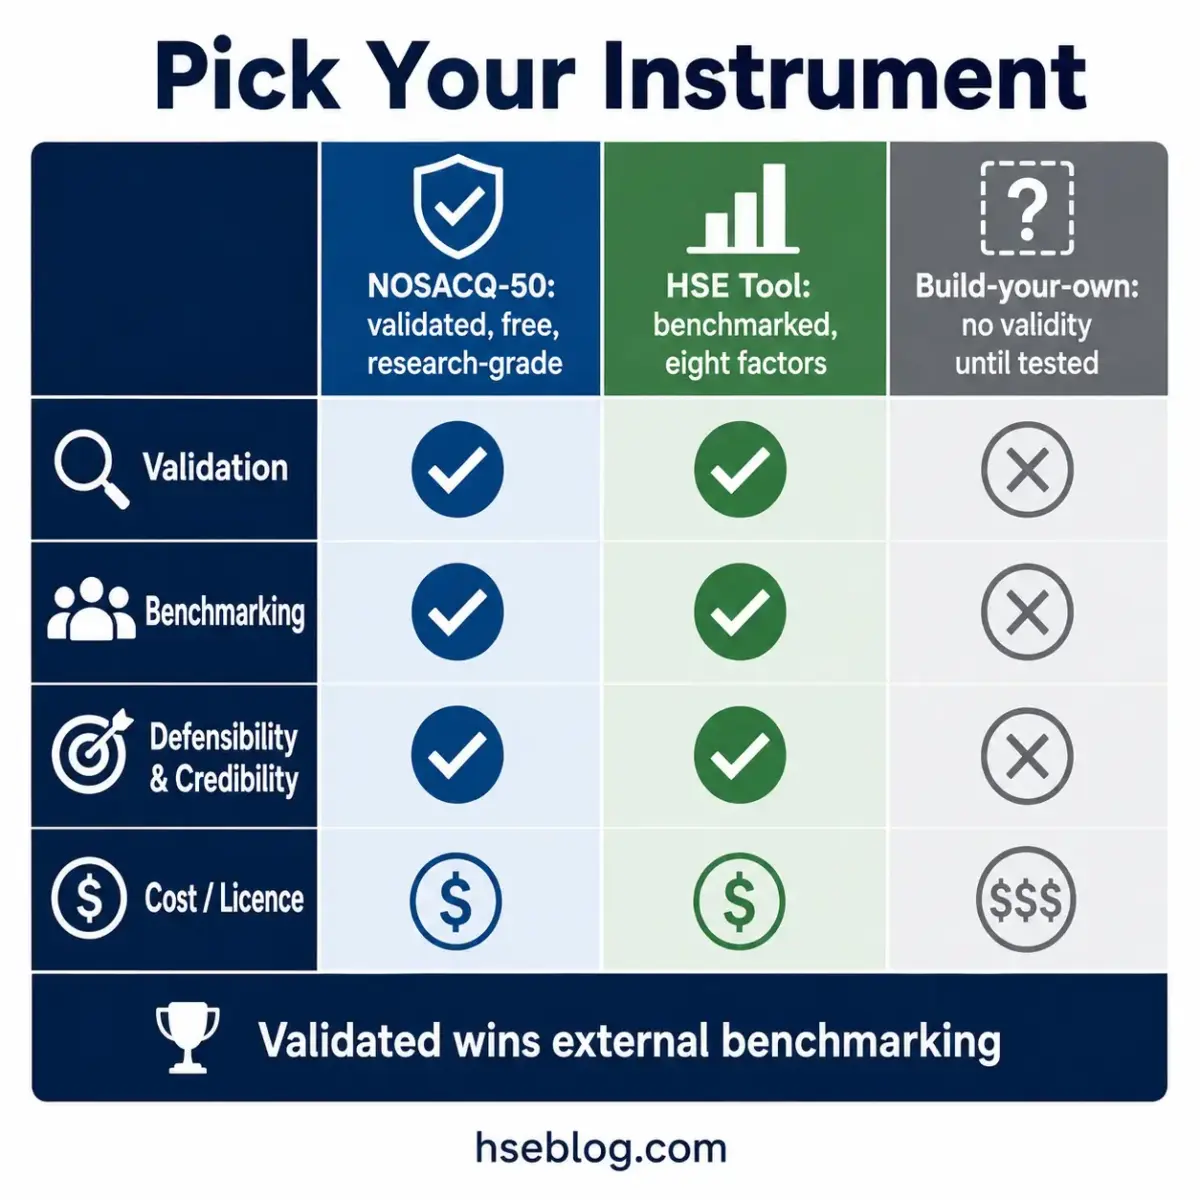
The single most consequential decision is whether you adopt a validated instrument, adapt one, or build your own — because that choice fixes how defensible and comparable your scores will be. For a first cycle, a validated tool is almost always the stronger call.
Three realistic routes, with the trade-offs laid out:
| Approach | Dimensions / factors | Validation status | Benchmarking | Cost / licence | Best fit |
|---|---|---|---|---|---|
| NOSACQ-50 | 50 items, 7 dimensions | Research-validated (Kines et al., 2011) | International research dataset | Free for non-commercial use | Research-grade diagnosis |
| HSE Safety Climate Tool | 40 questions, 8 factors | Official HSE instrument | UK sector-percentile benchmarking | Paid licence | Benchmarked culture tracking |
| Build-your-own | Whatever you define | None unless you pilot and statistically test it | None until you create your own baseline | Internal time and analysis cost | Niche needs after a validated first cycle |
NOSACQ-50 measures safety climate across 50 items grouped into 7 validated dimensions, with demonstrated reliability and predictive validity for safety motivation, perceived safety level, and self-rated behaviour (Kines et al., International Journal of Industrial Ergonomics, 2011) — the validation study behind the NOSACQ-50. On the UK side, HSE's Safety Climate Tool and its eight safety climate factors come with sector benchmarking that a homemade survey simply cannot offer.
Here is the trade-off practitioners routinely underweight. A bespoke survey "tailored to us" feels more relevant, but it forfeits established validity and the ability to benchmark externally — and that relevance gain rarely offsets the credibility loss, especially when results land in front of a board or an auditor.
One freshness note worth factoring in: established instruments are being modernised. Since around 2023, vendors and developers have added psychological-safety and Human and Organizational Performance (HOP) constructs and multi-level maturity scoring, reflecting a market shift beyond compliance-style questionnaires (Caterpillar Safety Services, 2023 — noted here as a market trend, not an endorsement).
The NOSACQ-50 and HSE Safety Climate Tool Dimensions
What these tools measure tells you what any credible instrument should cover. Expect dimensions along these lines:
- Management safety priority and commitment — does leadership act on safety when it costs time or money?
- Management safety empowerment and justice — are workers trusted and treated fairly after raising concerns or reporting?
- Workers' safety commitment and priority — does the workforce take safety seriously among peers?
- Safety communication, learning, and trust — are concerns heard, and is reporting genuinely safe?
- Confidence in procedures and the safety system — do the rules match how work actually gets done?
If a questionnaire only asks about rule-following and PPE, it is measuring compliance, not climate — and it will miss the trust and justice dimensions where most real problems live.
How to Design a Valid and Reliable Safety Perception Survey
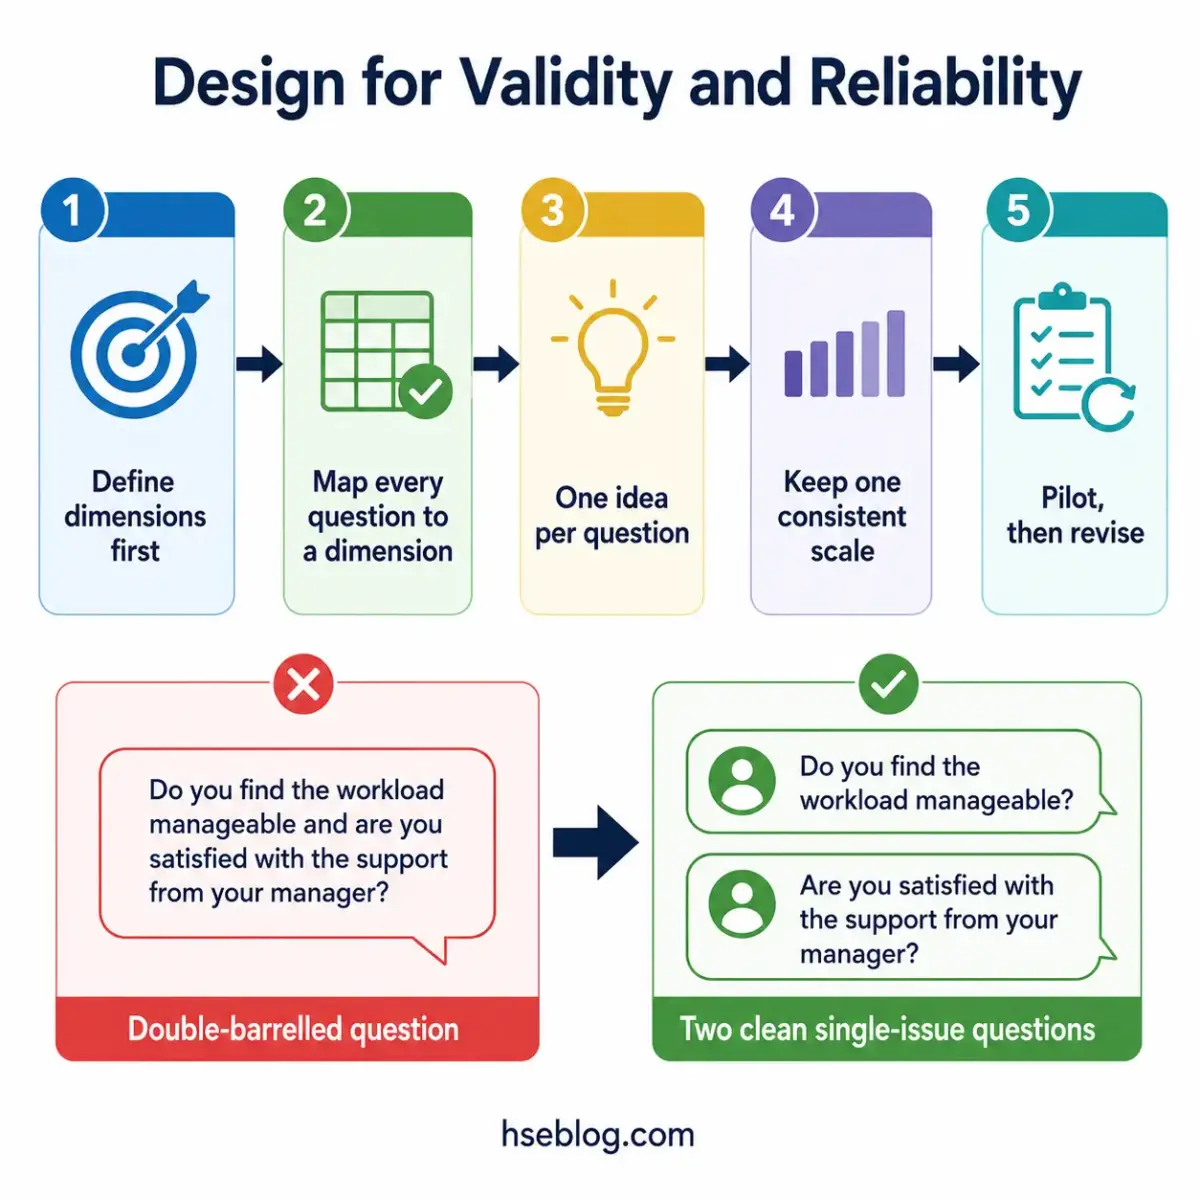
The most common design failure is invisible: the double-barrelled question that quietly corrupts a dimension's score. "My manager listens to safety concerns and acts on them" — if one half is true and the other false, the respondent has no honest way to score it, and your data is contaminated before analysis begins.
Validity and reliability are not optional polish. Validity asks whether the survey measures what you intend; reliability asks whether it measures consistently. A good design protects both.
Work through this sequence:
- Define purpose and dimensions first. Decide what you're measuring (e.g., trust, management commitment, reporting confidence) before you write a single item.
- Map every question to a dimension. Any item that doesn't belong to a defined dimension is a candidate for cutting.
- Write clean, single-issue items. One idea per question; avoid leading, ambiguous, or double-barrelled wording.
- Use one consistent Likert scale. Mixing scales across sections breaks comparability and confuses respondents.
- Pilot before launch. Test with a small group, check that items behave consistently, and revise anything that reads two ways.
A quick contrast makes the standard concrete:
- Poor item: "My manager listens to safety concerns and acts on them." (Two claims, one box.)
- Better items: "My manager listens to my safety concerns." / "My manager acts on safety concerns that are raised." (Two clean signals you can score separately.)
If you adopt a validated instrument, this work is largely done for you — which is, again, the strongest argument for not building from scratch on a first cycle.
Question Types, Scales, and the Anonymity Requirement
Anonymity is not a courtesy; it is the precondition for honest data. People will not rate management justice candidly if they believe their answers are traceable, so a guaranteed-anonymous design is what separates a real climate reading from a satisfaction theatre.
Practical rules for scales and protection:
- Use a balanced Likert scale (typically agree–disagree across five or seven points), kept identical throughout.
- Collect demographics for segmentation, not identification — role, site, or tenure bands, never anything that singles a person out.
- Set minimum reporting group sizes so no segment can be cross-referenced down to an individual; suppress any group below threshold.
- Consider third-party administration when internal trust is low or teams are small.
The tension to manage: segmentation is what lets you find the perception gap, but over-granular demographics destroy the anonymity that makes the answers truthful. Err toward broader bands.
Implementing the Survey: Sampling, Communication, and Response Rates
A good instrument can still fail in the field if you survey the wrong people, communicate poorly, or burn the trust that drives honest participation. Execution decisions deserve as much care as design.
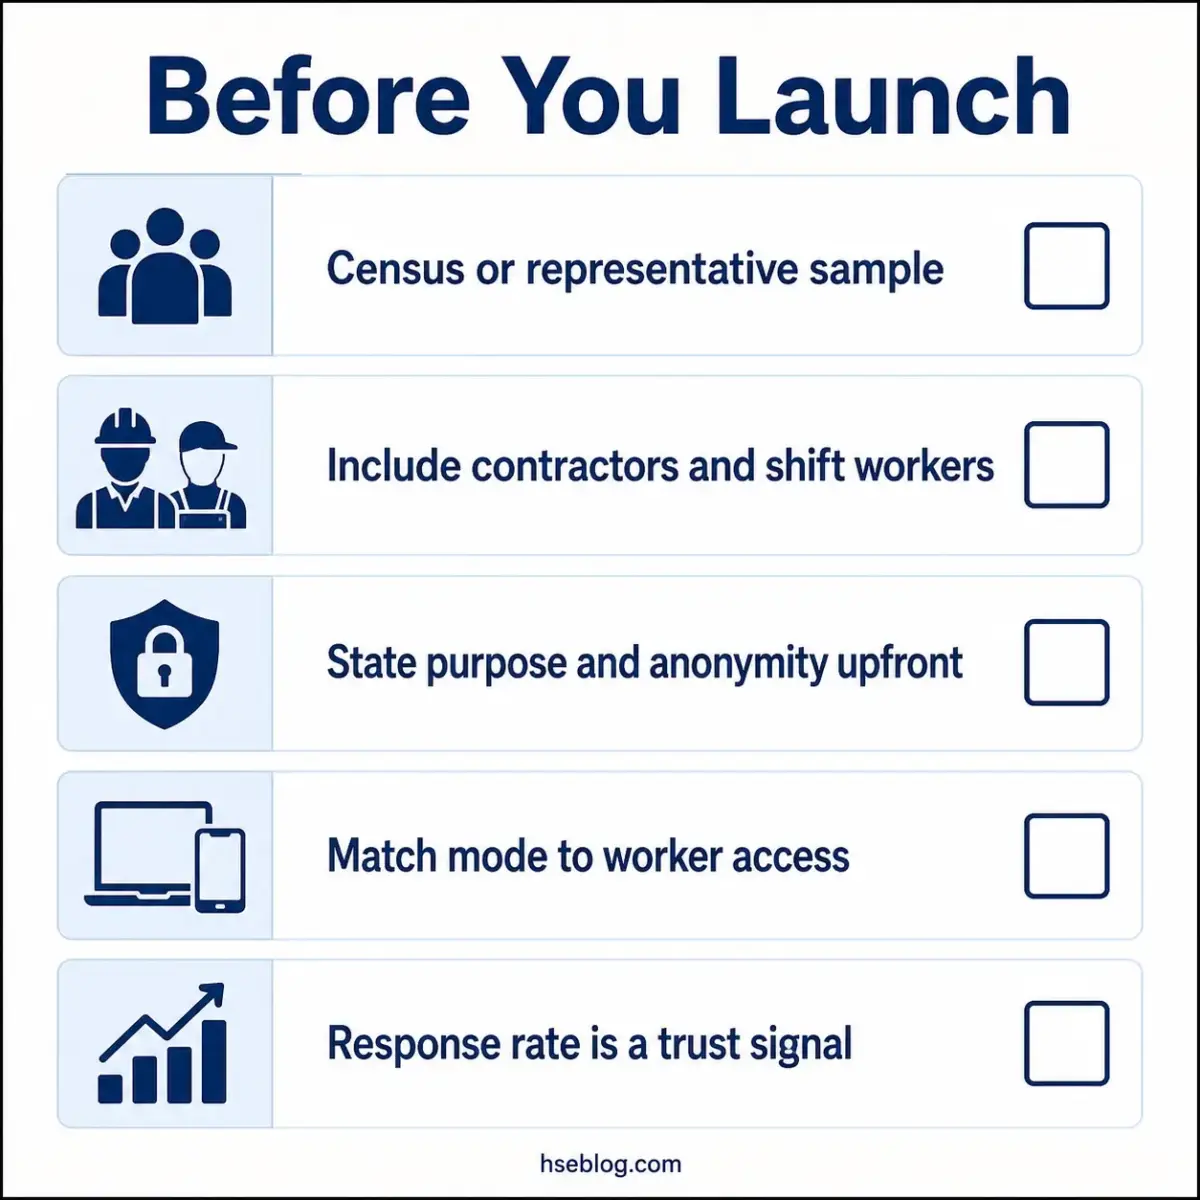
Run the field phase against this checklist:
- Decide census vs sample. A census (everyone) is usually preferable for climate work; if you sample, make it genuinely representative across roles and shifts.
- Include the easy-to-forget population. Contractors, shift workers, and temporary staff often experience the weakest climate — leaving them out hides exactly the data you need.
- Communicate before launch. State plainly what the survey is for, the anonymity guarantee, and how results will be used.
- Match the administration mode to access. Online suits desk-based teams; paper-to-scan or kiosk access reaches frontline and shift workers without devices.
- Remove participation barriers. Address language, literacy, and shift-timing access, or your sample skews toward the already-engaged.
Treat the response rate as a climate signal, not just a logistics number. A trust-destroying pattern recurs across organisations: a previous survey was run, the results were never shared, and the next cycle's response rate collapses — the silence itself taught people that participating changes nothing.
There is no universal "good" response rate. Representativeness matters more than a raw percentage, and some instruments set minimum reporting thresholds rather than target rates, so chase a representative, trusted sample rather than a vanity number.
Analysing and Benchmarking the Results
Read the pattern, not a single number. The analytical value of a perception survey lies in how dimensions relate to each other and how groups differ — not in whether one score crossed an arbitrary line.
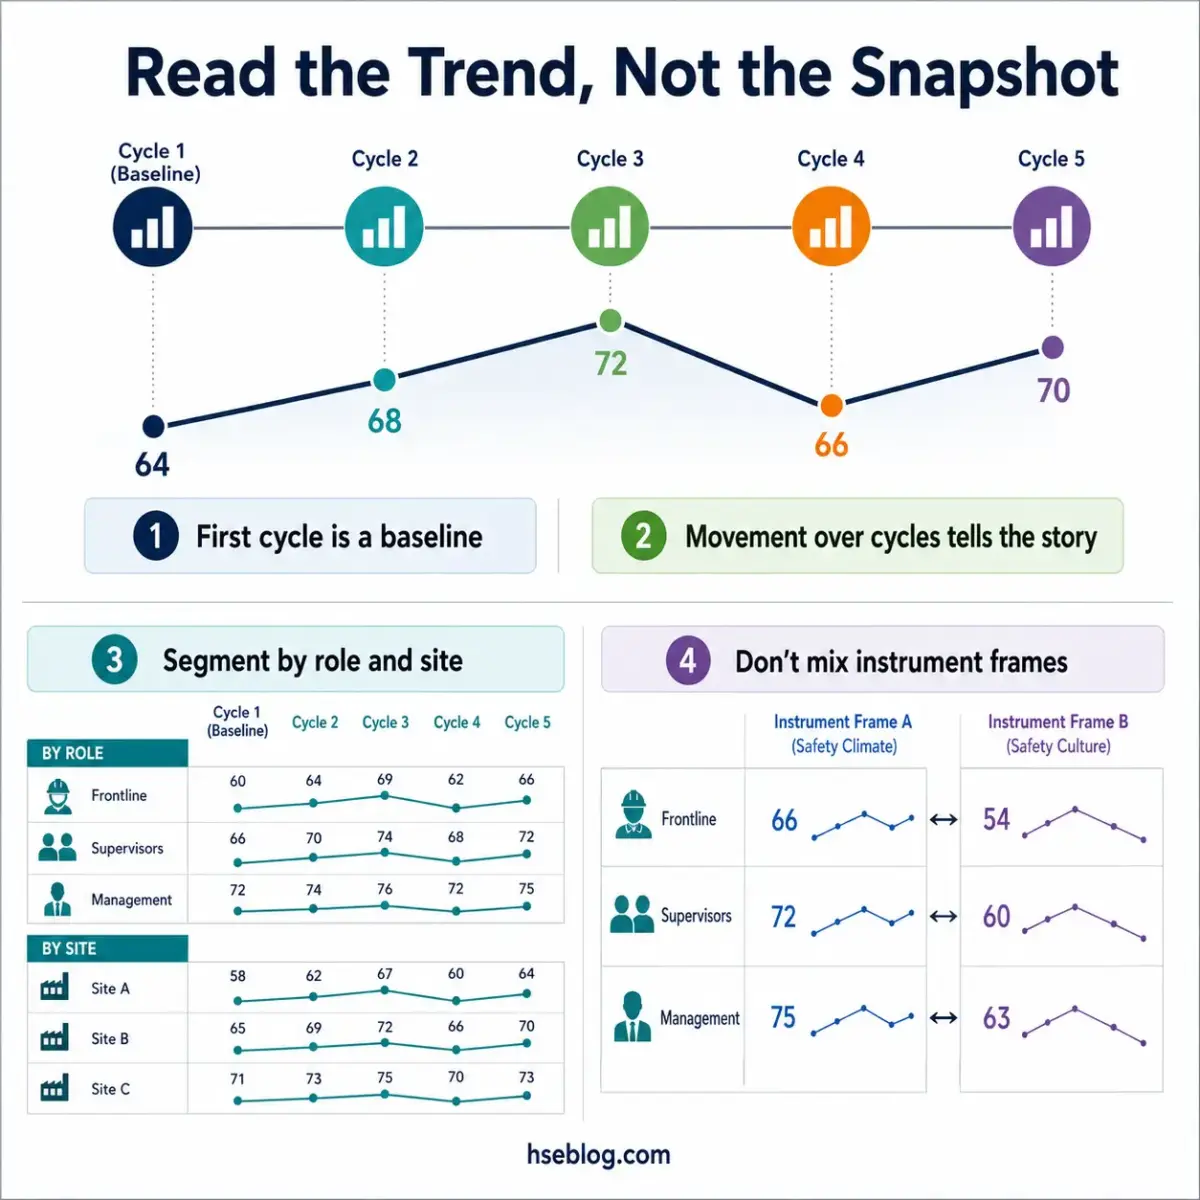
Different instruments use different interpretation frames, and mixing them produces nonsense:
| Instrument | Interpretation frame | "Good" signal |
|---|---|---|
| NOSACQ-50 | Absolute dimension cut-off | A dimension score above roughly 3.30 |
| HSE Safety Climate Tool | Sector-percentile benchmarking | Standing well within or above your sector profile |
Scores from different instruments are not directly comparable, and when results are borderline the more conservative interpretation should govern. Don't average a NOSACQ dimension against an HSE factor and call it a trend.
Three principles keep analysis honest:
- Segment to find gaps, then protect anonymity. Break results by role, site, and tenure to locate the worker–manager or site-to-site deltas — but suppress any group below your minimum reporting size.
- Read across dimensions. A single low dimension treated as an isolated "problem to fix" usually misleads; the meaning is in the relationship between dimensions and the gap between groups.
- Trend beats snapshot. A first cycle is a baseline, not a verdict; movement over two or three cycles is where the real story emerges.
Expect interpretation to broaden over time. HSE's 2024/25 strategy signals inspectors increasingly weighing psychological health alongside physical risk, and modern instruments now fold psychological-safety constructs into the dimensions you'll be reading (British Safety Council, 2025).
From Results to Action: Closing the Loop
The dominant way these programmes fail is the survey-as-checkbox cycle: data is collected, filed, and never acted on. Both auditors and workers detect this quickly, and it actively damages climate rather than measuring it neutrally — you are better off not surveying than surveying and going silent.
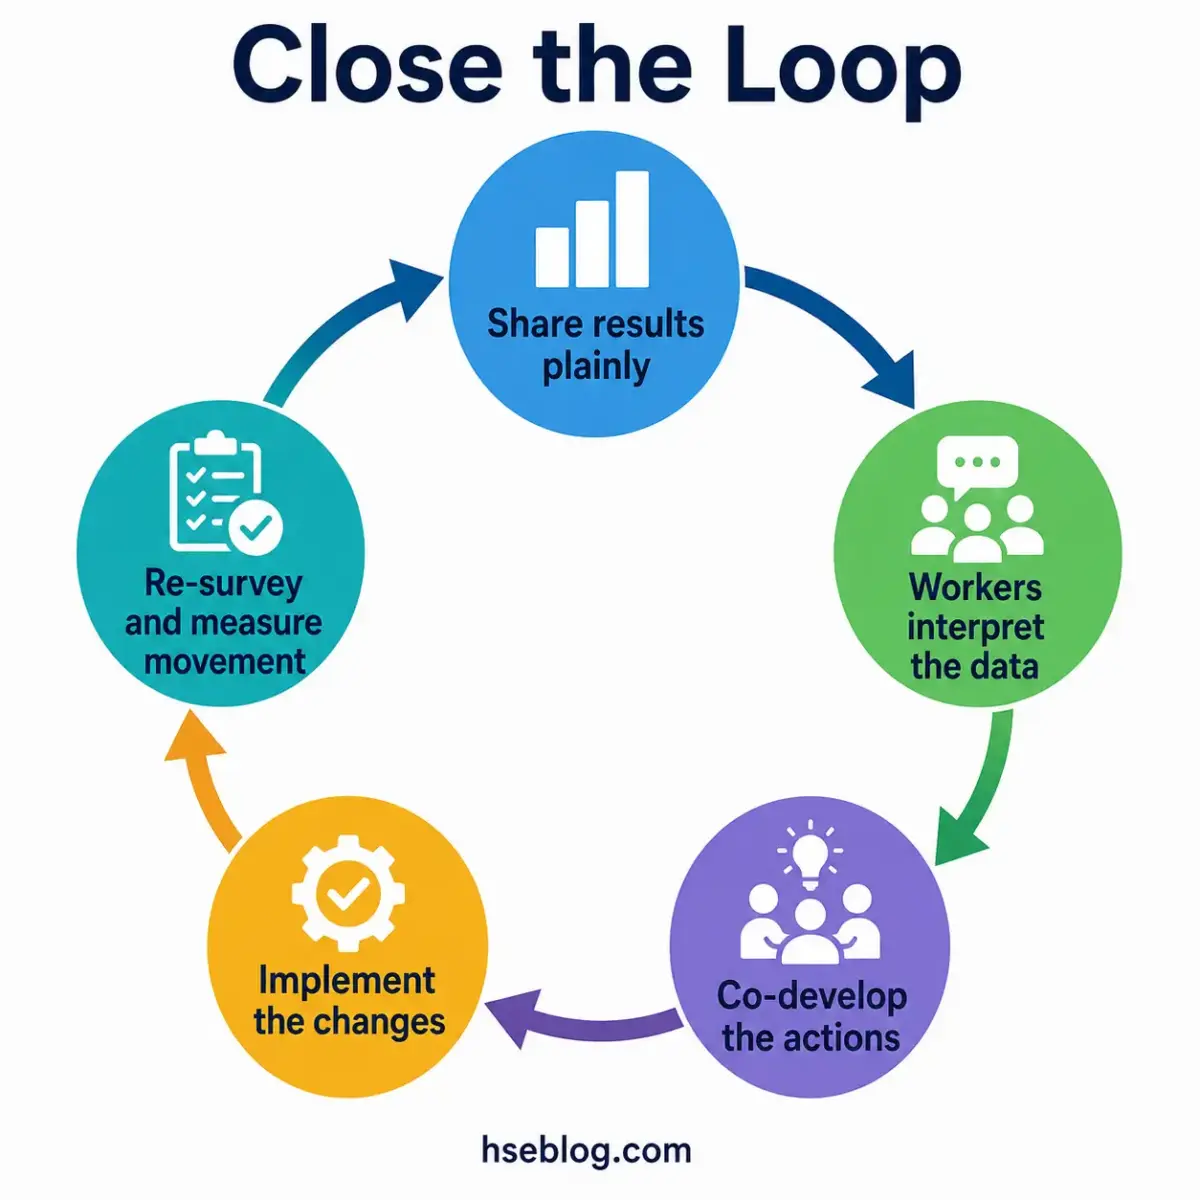
The survey only generates value in the loop that follows it. Run it deliberately:
- Feed results back in plain language. Share what the scores said, including what won't change and why — honesty here protects the next cycle's response rate.
- Involve workers in interpreting the data. Frontline teams explain why a dimension scored low far better than a spreadsheet can.
- Co-develop the actions with workers. This is where ISO 45001 Clause 5.4 shifts from consultation to genuine participation — a perception survey alone is unilateral and doesn't fully satisfy the two-way participation duty (global, 2018).
- Re-survey on a defined cycle. Set the cadence in advance so you can measure movement rather than guess at it.
- Guard against survey fatigue. Too frequent and people stop engaging; too rare and you can't link movement to anything you did.
One result confuses leaders predictably and deserves naming: scores sometimes get worse after you act. Raised attention and improved psychological safety can increase candour and reporting, temporarily lowering scores — read that drop against your engagement and reporting dimensions before treating it as a failure.
Frequently Asked Questions
How often should you run a safety perception survey?
Most organisations land on a 12–24 month cycle. Run a baseline first, then re-survey to track trend without triggering survey fatigue. Tie the cadence to your purpose: a tighter cycle suits evaluating a specific intervention, while a longer one suits routine monitoring of a stable climate.
What's the difference between safety climate and safety culture?
Climate is the measurable layer — workers' shared perceptions at a point in time. Culture is the deeper, slower-changing whole: the embedded values and habits beneath those perceptions. A perception survey measures climate as a proxy for culture, because the culture itself can't be captured directly in a questionnaire.
Are safety perception surveys legally required?
There is no standalone legal mandate to run one. However, ISO 45001 Clause 5.4 requires processes for worker consultation and participation (global), and OSHA frameworks treat perception data as a recognised leading indicator (US). Consultation duties are jurisdiction-specific, so verify your local obligations — this is general HSE guidance, not legal advice.
How do you guarantee anonymity in a small team?
Use minimum reporting group sizes and suppress any segment that falls below the threshold. Avoid over-granular demographics that could identify someone, and consider third-party administration so no internal party sees raw responses. Some tools report only at a minimum number of responses, which protects small groups by design.
NOSACQ-50 vs the HSE Safety Climate Tool — which should I use?
NOSACQ-50 is research-validated, free for non-commercial use, and suits research-grade diagnosis across seven dimensions (Kines et al., 2011). The HSE Safety Climate Tool offers eight factors with UK sector-percentile benchmarking under licence. Choose by goal: diagnostic depth points to NOSACQ-50; benchmarked culture tracking points to the HSE tool.
Why did our survey scores get worse after we took action?
Often this is the awareness effect, not a real decline. Raising attention to safety and improving psychological safety increases candour, so people report problems they previously stayed quiet about. Read the drop against your engagement and reporting dimensions — rising candour with falling scores is frequently a sign the climate is improving.
Conclusion
Before your next cycle, ask one uncomfortable question: if you handed your current survey to a methodologist, would it survive? Count the double-barrelled items, check whether anonymity is genuinely protected at small-group level, and confirm every question maps to a defined dimension — most homemade instruments fail at least one of these tests, and the resulting scores have been steering decisions anyway.
Then ask the harder question about the loop. If you've run a safety perception survey before, were the results fed back to the workforce in plain language, and did workers help build the actions that followed? Where the answer is no, the silence has already taught your people that participating changes nothing — and your next response rate will tell you exactly how much that cost.
The organisations that get value from this don't chase a flattering number; they treat the survey as a validated, repeatable reading of a leading indicator, expose the manager–worker gap honestly, and act in the open. Pick a tested instrument, protect anonymity without compromise, and commit to closing the loop before you collect a single response — because a survey nobody acts on doesn't measure your safety climate, it lowers it.